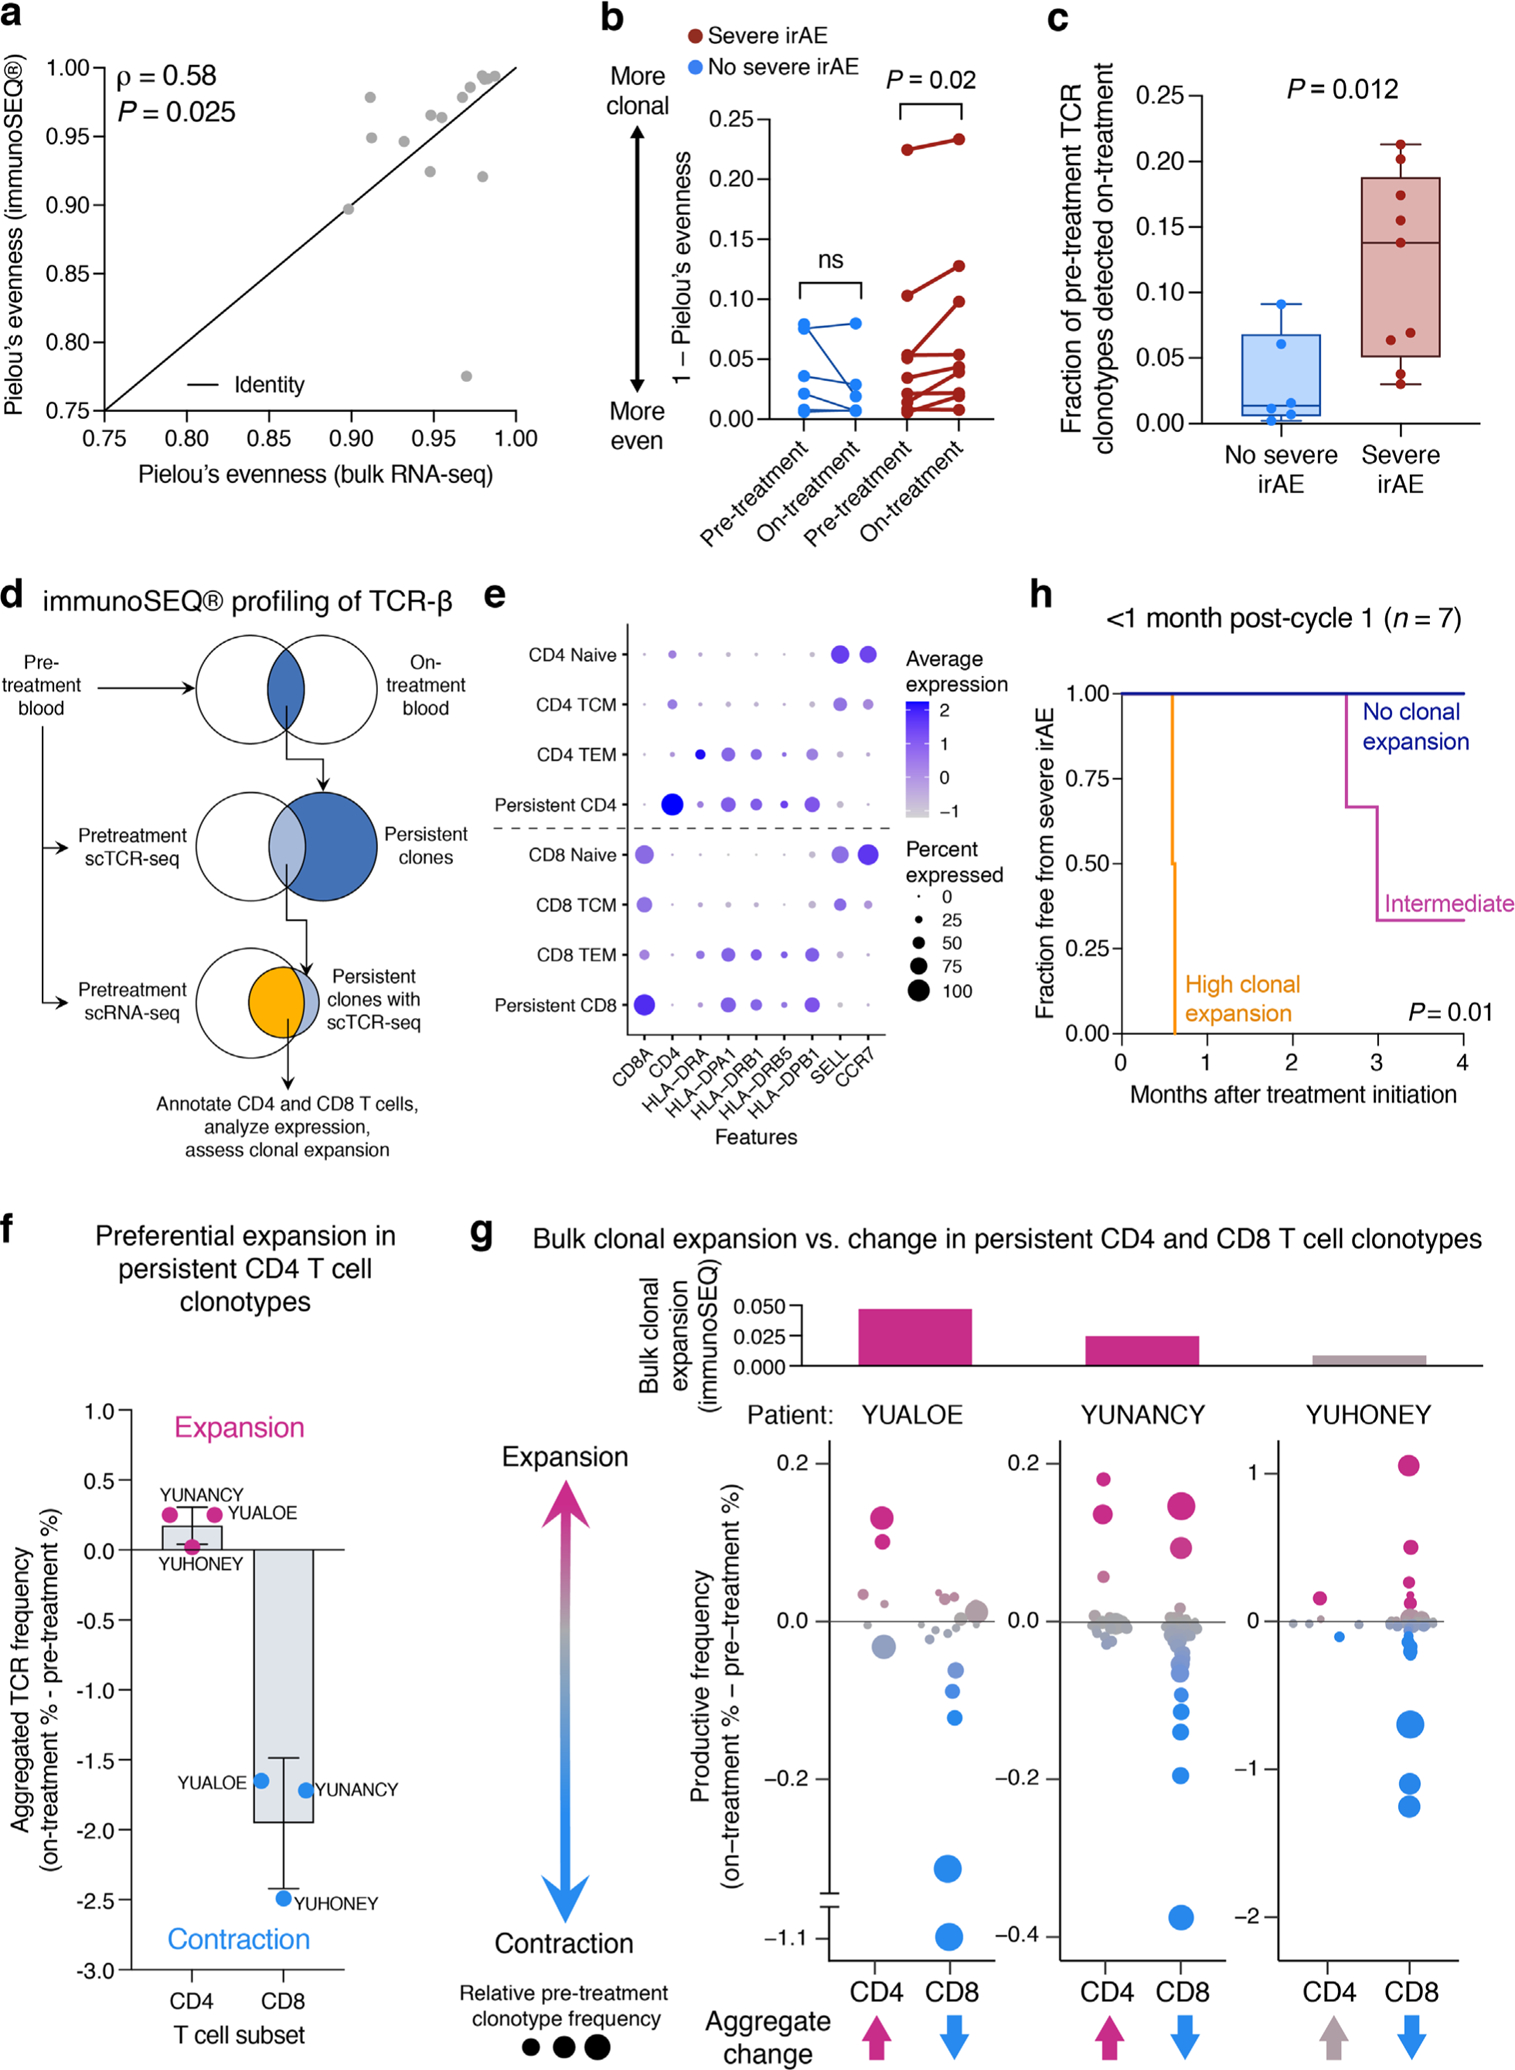
Extended Data Fig. 9 |. Peripheral blood TCR-β profiling with immunoSEQ®.

a, Evenness (Pielou’s index) of TCR repertoires assembled by MiXCR (bulk RNA-seq) and immunoSEQ® (genomic DNA) from paired pretreatment PBMC samples (n = 15 combination therapy patients) (Supplementary Tables 1 and 18). Concordance and significance were determined by Spearman ρ and a two-sided t test, respectively. b, Similar to Fig. 5b but showing clonality for each pre- and on-treatment PBMC sample (Supplementary Table 18). Statistical significance was determined by a two-sided, paired Wilcoxon rank sum test. ns, not significant (P > 0.05). c, Fraction of pretreatment peripheral blood TCR clonotypes detected on-treatment in 15 combination therapy patients (Supplementary Table 18), stratified by no severe (n = 6) and severe (n = 9) irAE status. Clonotypes with matching productive CDR3 β-chain nucleotide sequences were considered identical. Center lines, bounds of the box, and whiskers indicate medians, 1st and 3rd quartiles, and minimum and maximum values, respectively. Significance was determined by a two-sided, unpaired Wilcoxon rank sum test. d–g, Clonal dynamics in circulating T cells following combination therapy initiation. d, Persistent T cell clones identified by immunoSEQ® were cross-referenced with scTCR-seq and scRNA-seq data of pretreatment PBMCs from the same three patients (YUALOE, YUNANCY, YUHONEY), all of whom received combination therapy and developed severe ICI-induced toxicity (Supplementary Table 18; Methods). e, Log2 expression of key lineage and activation markers across major T cell states annotated by Azimuth along with persistent clones classified into CD4 and CD8 T cells (Methods). f, Aggregate change from baseline in the productive frequencies of persistent clonotypes, stratified by lineage (n = 2 cell types) and patient (n = 3). The sum of the difference in productive frequencies (on-treatment % – pretreatment %) was calculated from immunoSEQ® data. Bars denote mean + /− SD. g, Top: Change in bulk TCR clonality from baseline (Fig. 5b). Bottom: Same as f but showing the underlying clonotypes, where circle size is proportional to pretreatment clone frequency (immunoSEQ®). h, Same as Fig. 5d but restricted to blood draws taken cycle 1 day 1 of combination therapy and <1 month later (n = 7 patients; Supplementary Table 18).
