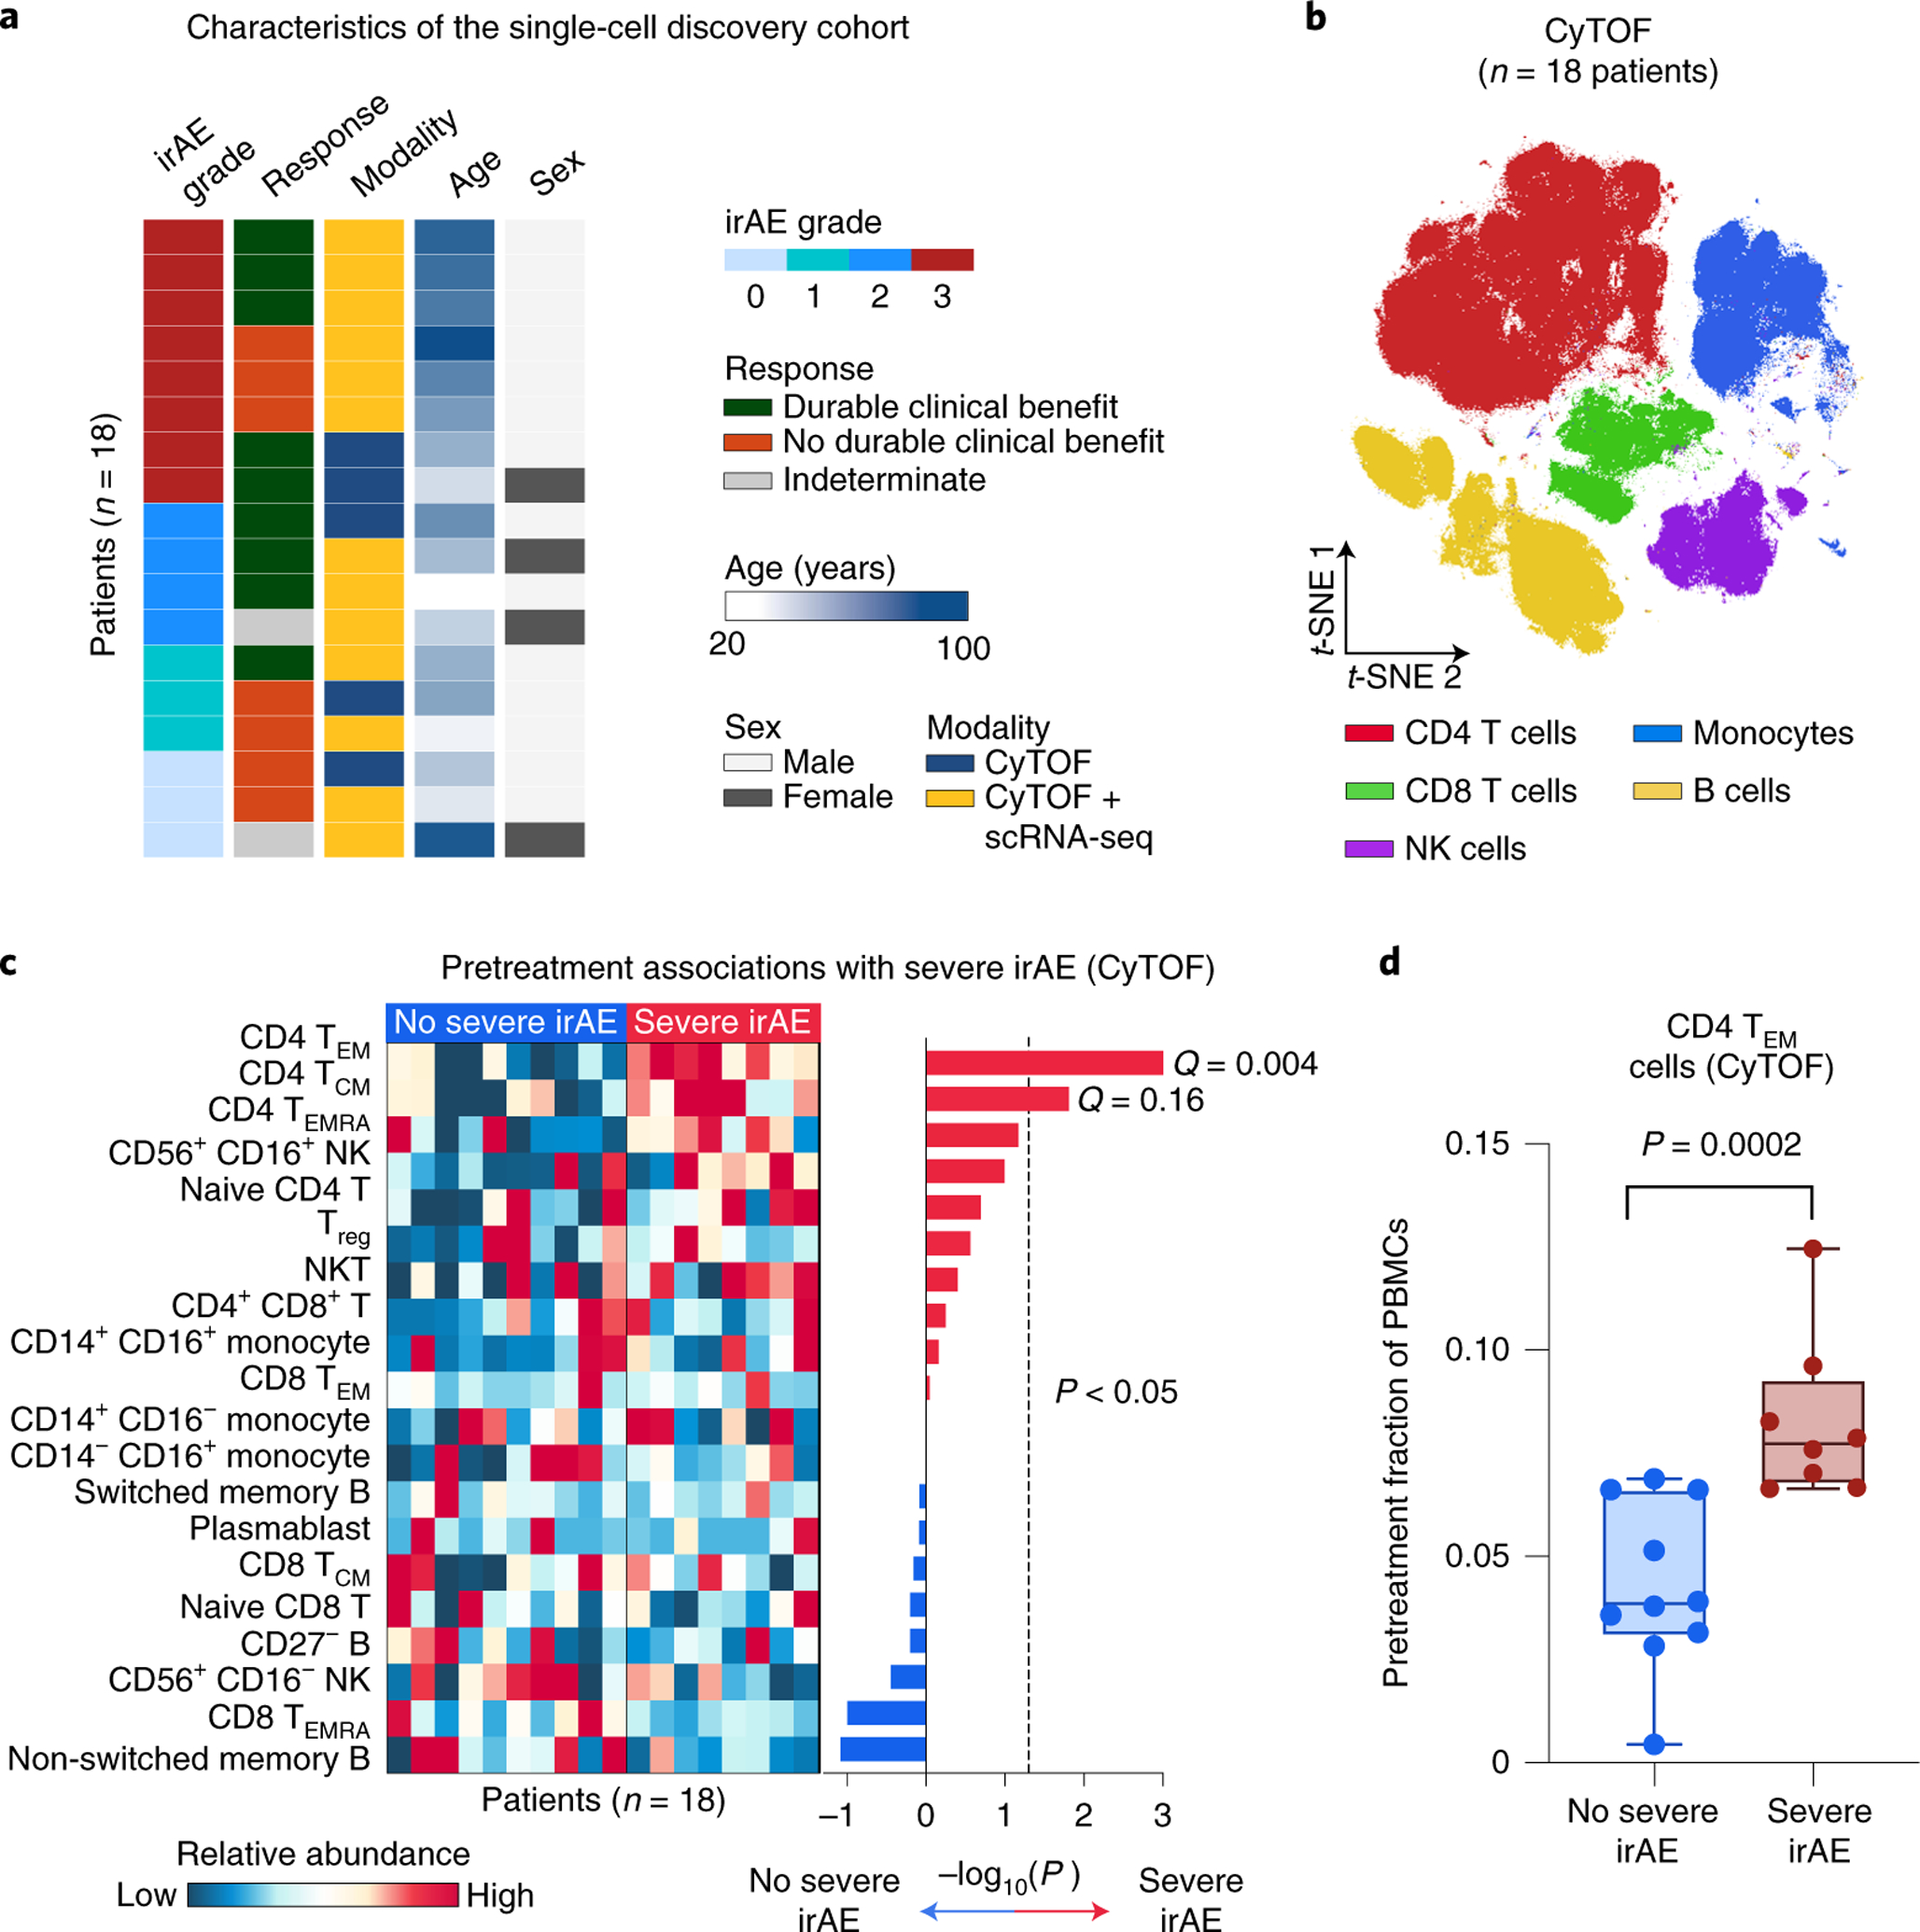
Fig. 2 |. Analysis of pretreatment peripheral blood for cellular determinants of severe irAEs using mass cytometry.

a, Characteristics of the single-cell discovery cohort (Fig. 1), including the highest irAE grade experienced and durable clinical response status after the start of immunotherapy (related to Supplementary Tables 2 and 3). b, viSNE projection of peripheral blood cells analyzed by CyTOF. t-SNE, t-distributed stochastic neighbor embedding. c, Left: Heatmap showing the relative abundance of 20 cell states identified by CyTOF in 18 patients (Supplementary Table 5), grouped by future irAE status. Right: Association of cell state abundance with severe irAE development. Statistical significance was determined by a two-sided, unpaired Wilcoxon rank-sum test and expressed as directional −log10 P values. For associations with no severe irAE, −log10 P values were multiplied by −1. Q values were determined by the Benjamini–Hochberg method. d, Frequencies of CD4 TEM cells (CyTOF) in the pretreatment peripheral blood of patients stratified by future irAE status (no severe irAE, n = 10 patients; severe irAE, n = 8 patients). The box center lines, box bounds and whiskers denote the medians, first and third quartiles and minimum and maximum values, respectively. Statistical significance was determined by a two-sided, unpaired Wilcoxon rank-sum test.
