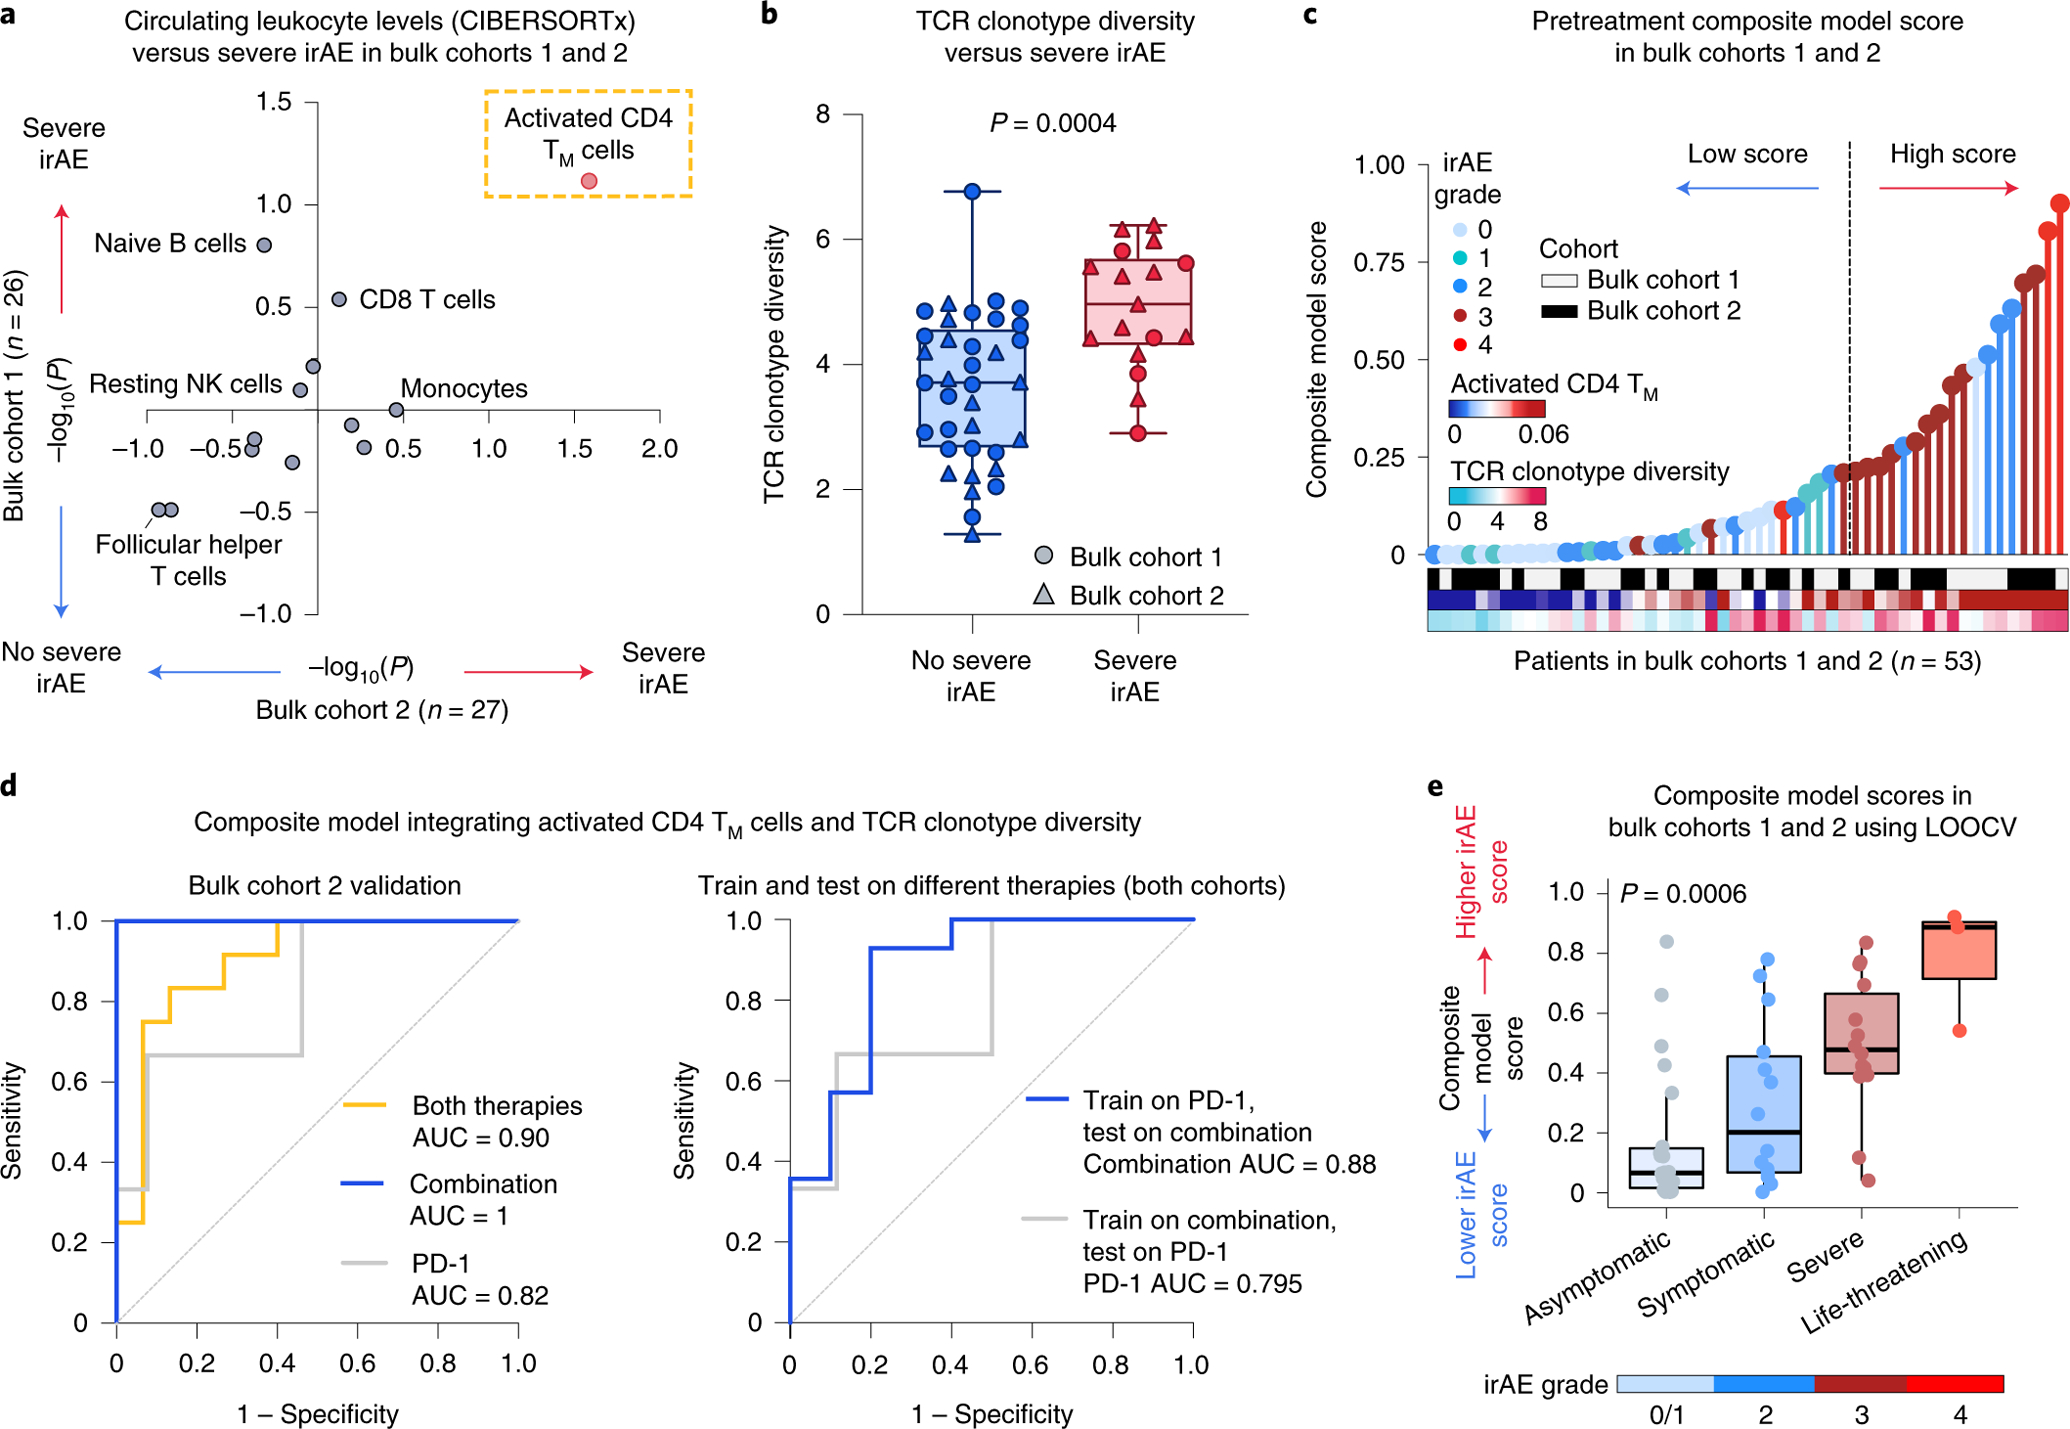
Fig. 4 |. Integrative modeling for early irAE detection from bulk peripheral blood.

a, Association between pretreatment peripheral blood leukocyte composition (CIBERSORTx) and severe irAE development in bulk cohort 1 (n = 26 patients) and bulk cohort 2 (n = 27 patients) (Fig. 1 and Supplementary Tables 7 and 9). Significance was determined by a two-sided, unpaired Wilcoxon rank-sum test and expressed as −log10 P values. For associations with no severe irAE, −log10 P values were multiplied by −1. b, TCR clonotype diversity (Shannon entropy) in both bulk cohorts (n = 53 patients), stratified by future irAE status (no severe irAE, n = 36; severe irAE, n = 17). The box center lines, box bounds and whiskers denote the medians, first and third quartiles and minimum and maximum values, respectively. Significance was determined by a two-sided, unpaired Wilcoxon rank-sum test. c, Development of a composite model for the prediction of severe irAEs, integrating activated CD4 TM cell abundance and TCR clonotype diversity from pretreatment peripheral blood transcriptomes (Methods), with model scores trained on bulk cohort 1 and shown across both cohorts (Supplementary Table 9). The cut-point for high/low scores was optimized using Youden’s J statistic on bulk cohort 1 (Methods). d, Left: ROC plot showing composite model performance in bulk cohort 2 (held-out validation), whether applied to all patients (both therapies, n = 27), combination therapy patients (n = 11) or PD-1 monotherapy patients (n = 16). Right: ROC plot showing composite model performance in bulk cohorts 1 and 2, whether trained on PD-1 patients (n = 29) and tested on combination therapy patients (n = 24) or vice versa. The AUC is shown for each ROC curve. e, Composite model scores for all bulk cohort patients (n = 53) after model training for severe irAE development with LOOCV (Extended Data Fig. 7a and Supplementary Table 9), grouped by the highest irAE grade per patient. The box center lines, box bounds and whiskers indicate the medians, first and third quartiles and minimum and maximum values within 1.5× the interquartile range of the box limits, respectively. Statistical significance was determined by a Kruskal–Wallis test.
