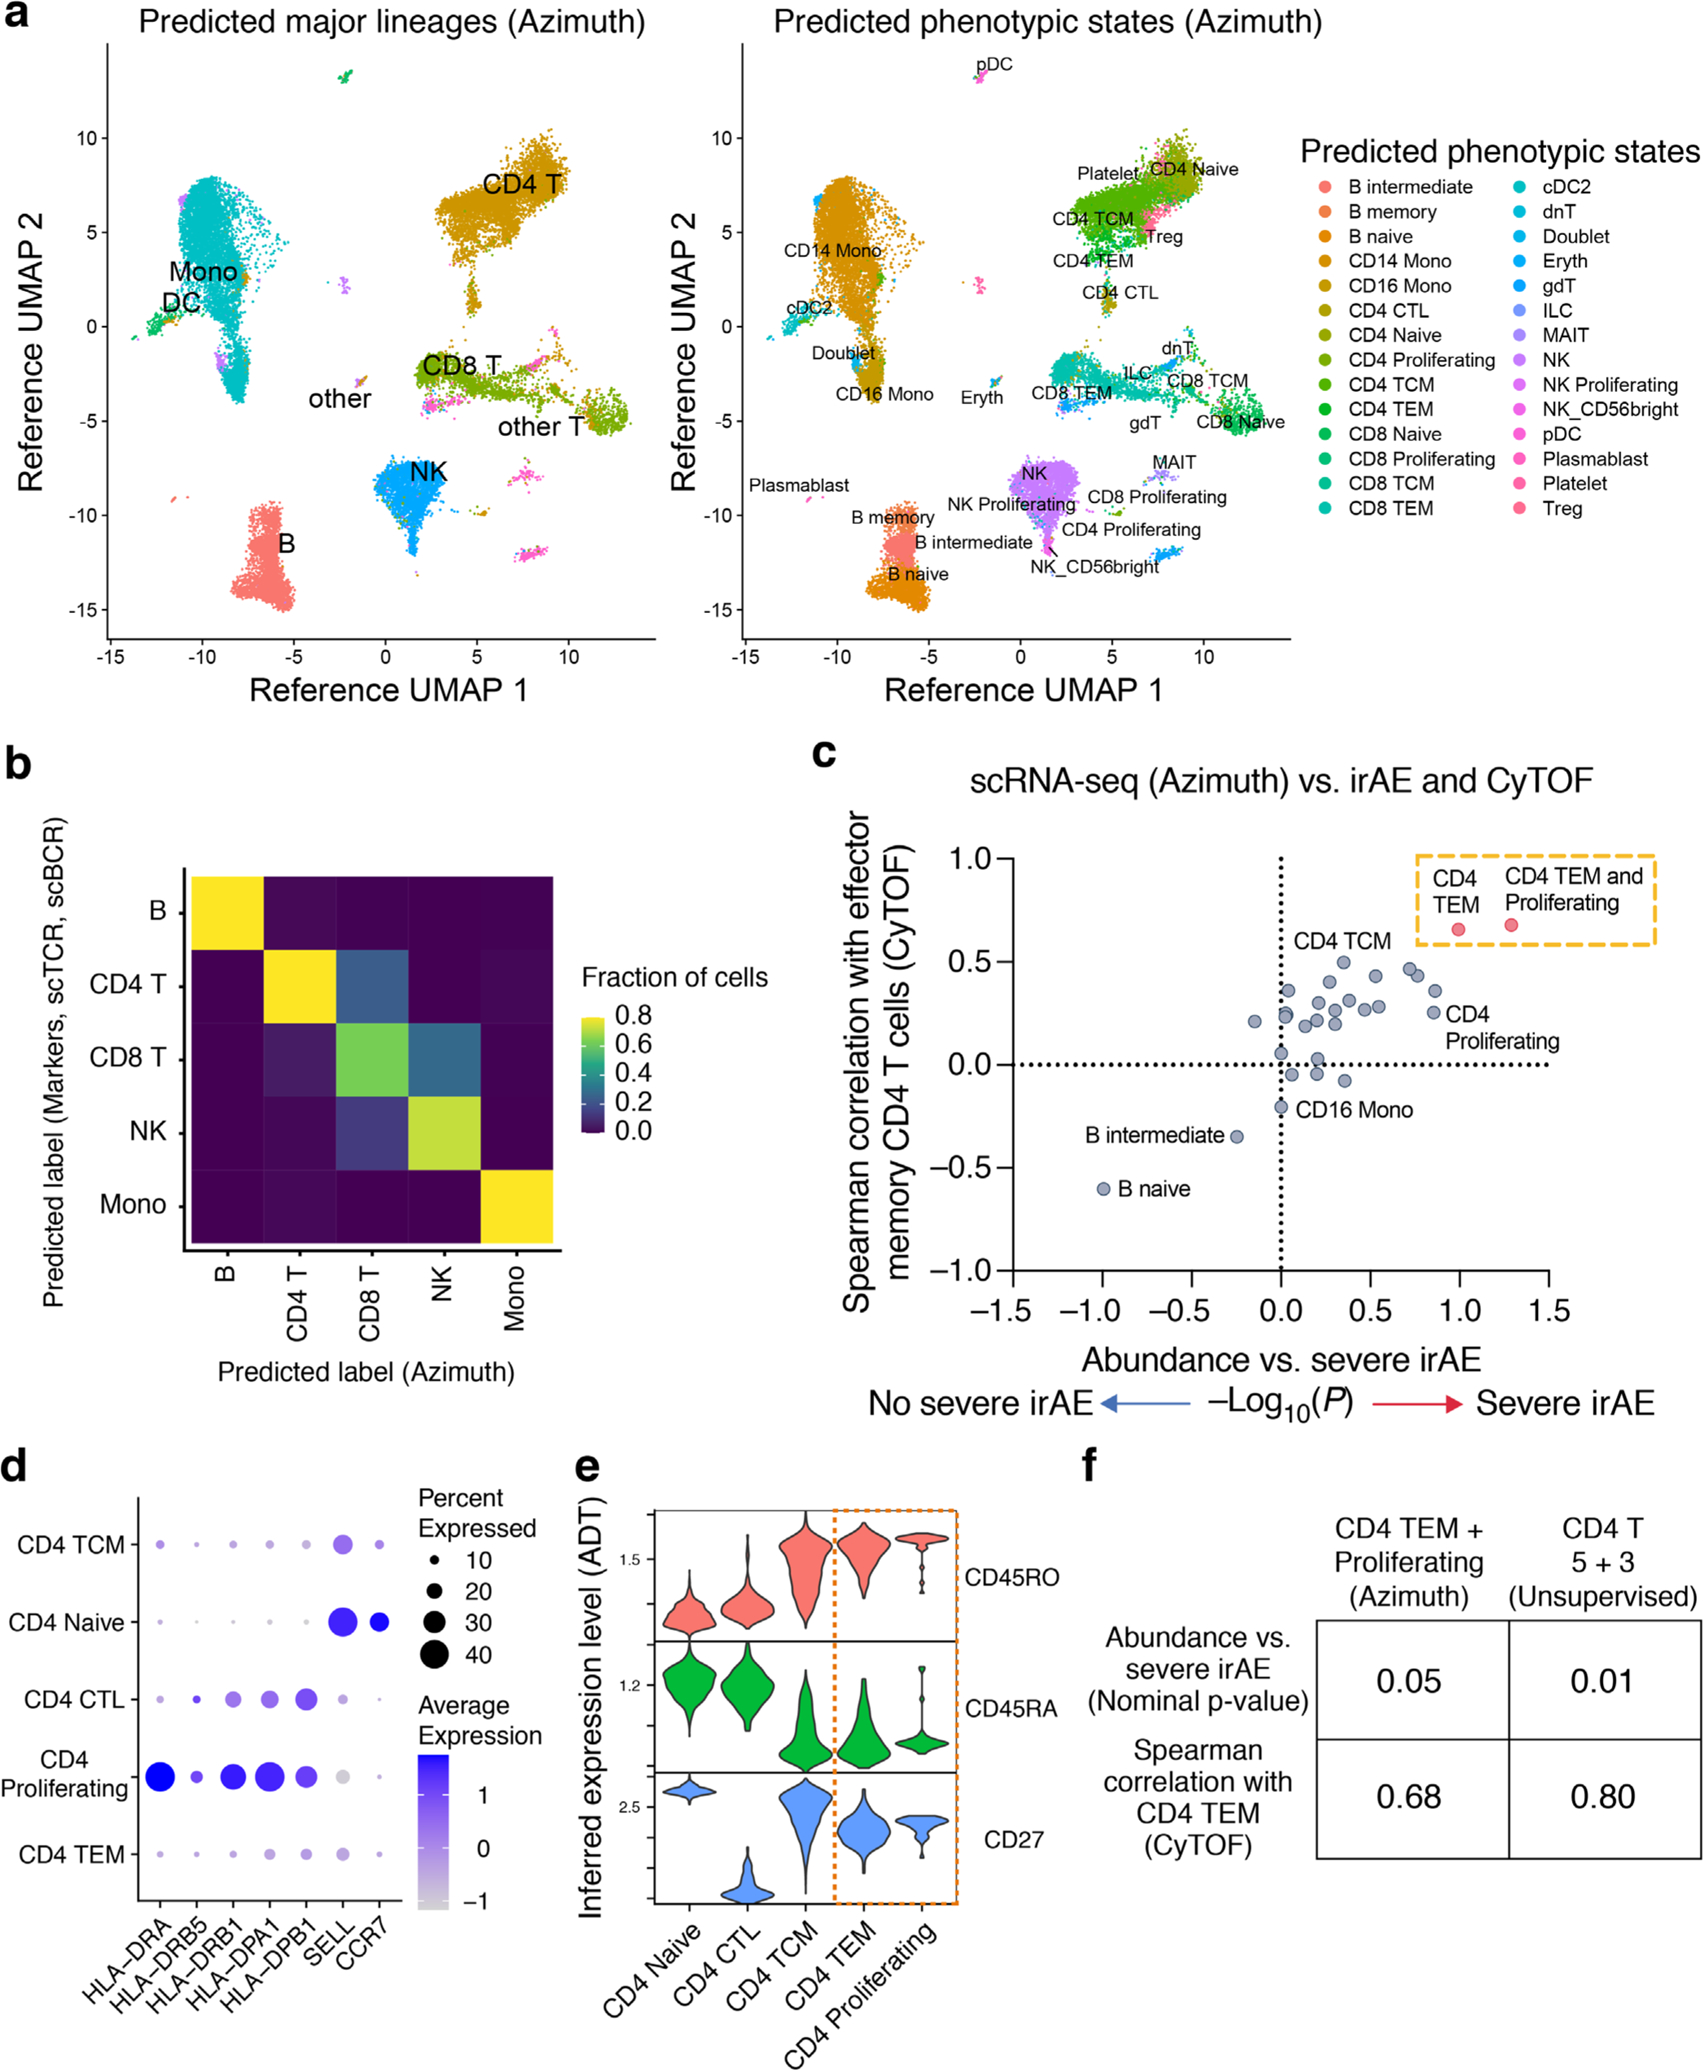
Extended Data Fig. 2 |. Analysis of scRNA-seq states identified by reference-guided annotation.

a, UMAP projections of scRNA-seq data generated in this work, embedded and labeled by Azimuth using a reference PBMC atlas of 162k cells profiled by scRNA-seq and 228 antibodies (Methods). b, Confusion matrix showing the agreement between phenotypic labels determined by marker genes and unsupervised clustering (rows; related to Fig. 3a and Extended Data Fig. 1a) versus reference-guided annotation with Azimuth (columns). In total, 85% of single cells assigned to a major lineage group by Azimuth (B cells, CD4 T, CD8 T, NK cells, monocytes) were assigned to the same identity by canonical marker gene assessment. Given the absence of NKT cells in the reference atlas used for Azimuth, the T/NKT cluster defined by unsupervised analysis was relabeled as CD8 T cells. c, Same analysis as in Fig. 3b but shown for all 27 phenotypic states identified by Azimuth. Among these states, CD4 TEM was most associated with severe irAE and CyTOF-enumerated CD4 TEM. A population combining CD4 TEM and CD4 Proliferating states was also strongly associated with severe irAE. The latter showed the highest expression of HLA-DX and lowest expression of SELL (panel d), consistent with an activated CD4 TEM phenotype. d, Dot plot depicting key activation and lineage markers among CD4 T cell states annotated by Azimuth. e, Violin plots showing protein expression levels imputed by Azimuth using antibody-derived tag (ADT) data, supporting the combination of CD4 TEM and CD4 Proliferating states in panels c and f. f, Performance of top-ranking cell subsets identified by Azimuth and unsupervised clustering for prediction of severe irAEs. The combined CD4 T 5 + 3 clusters (Fig. 3b) were more associated with severe irAE and CyTOF than the top-ranking reference-guided population (panel c). Statistical significance was calculated using a two-sided, unpaired Wilcoxon rank sum test. Data in all panels shown are from the 13 samples profiled by scRNA-seq in Fig. 3.
