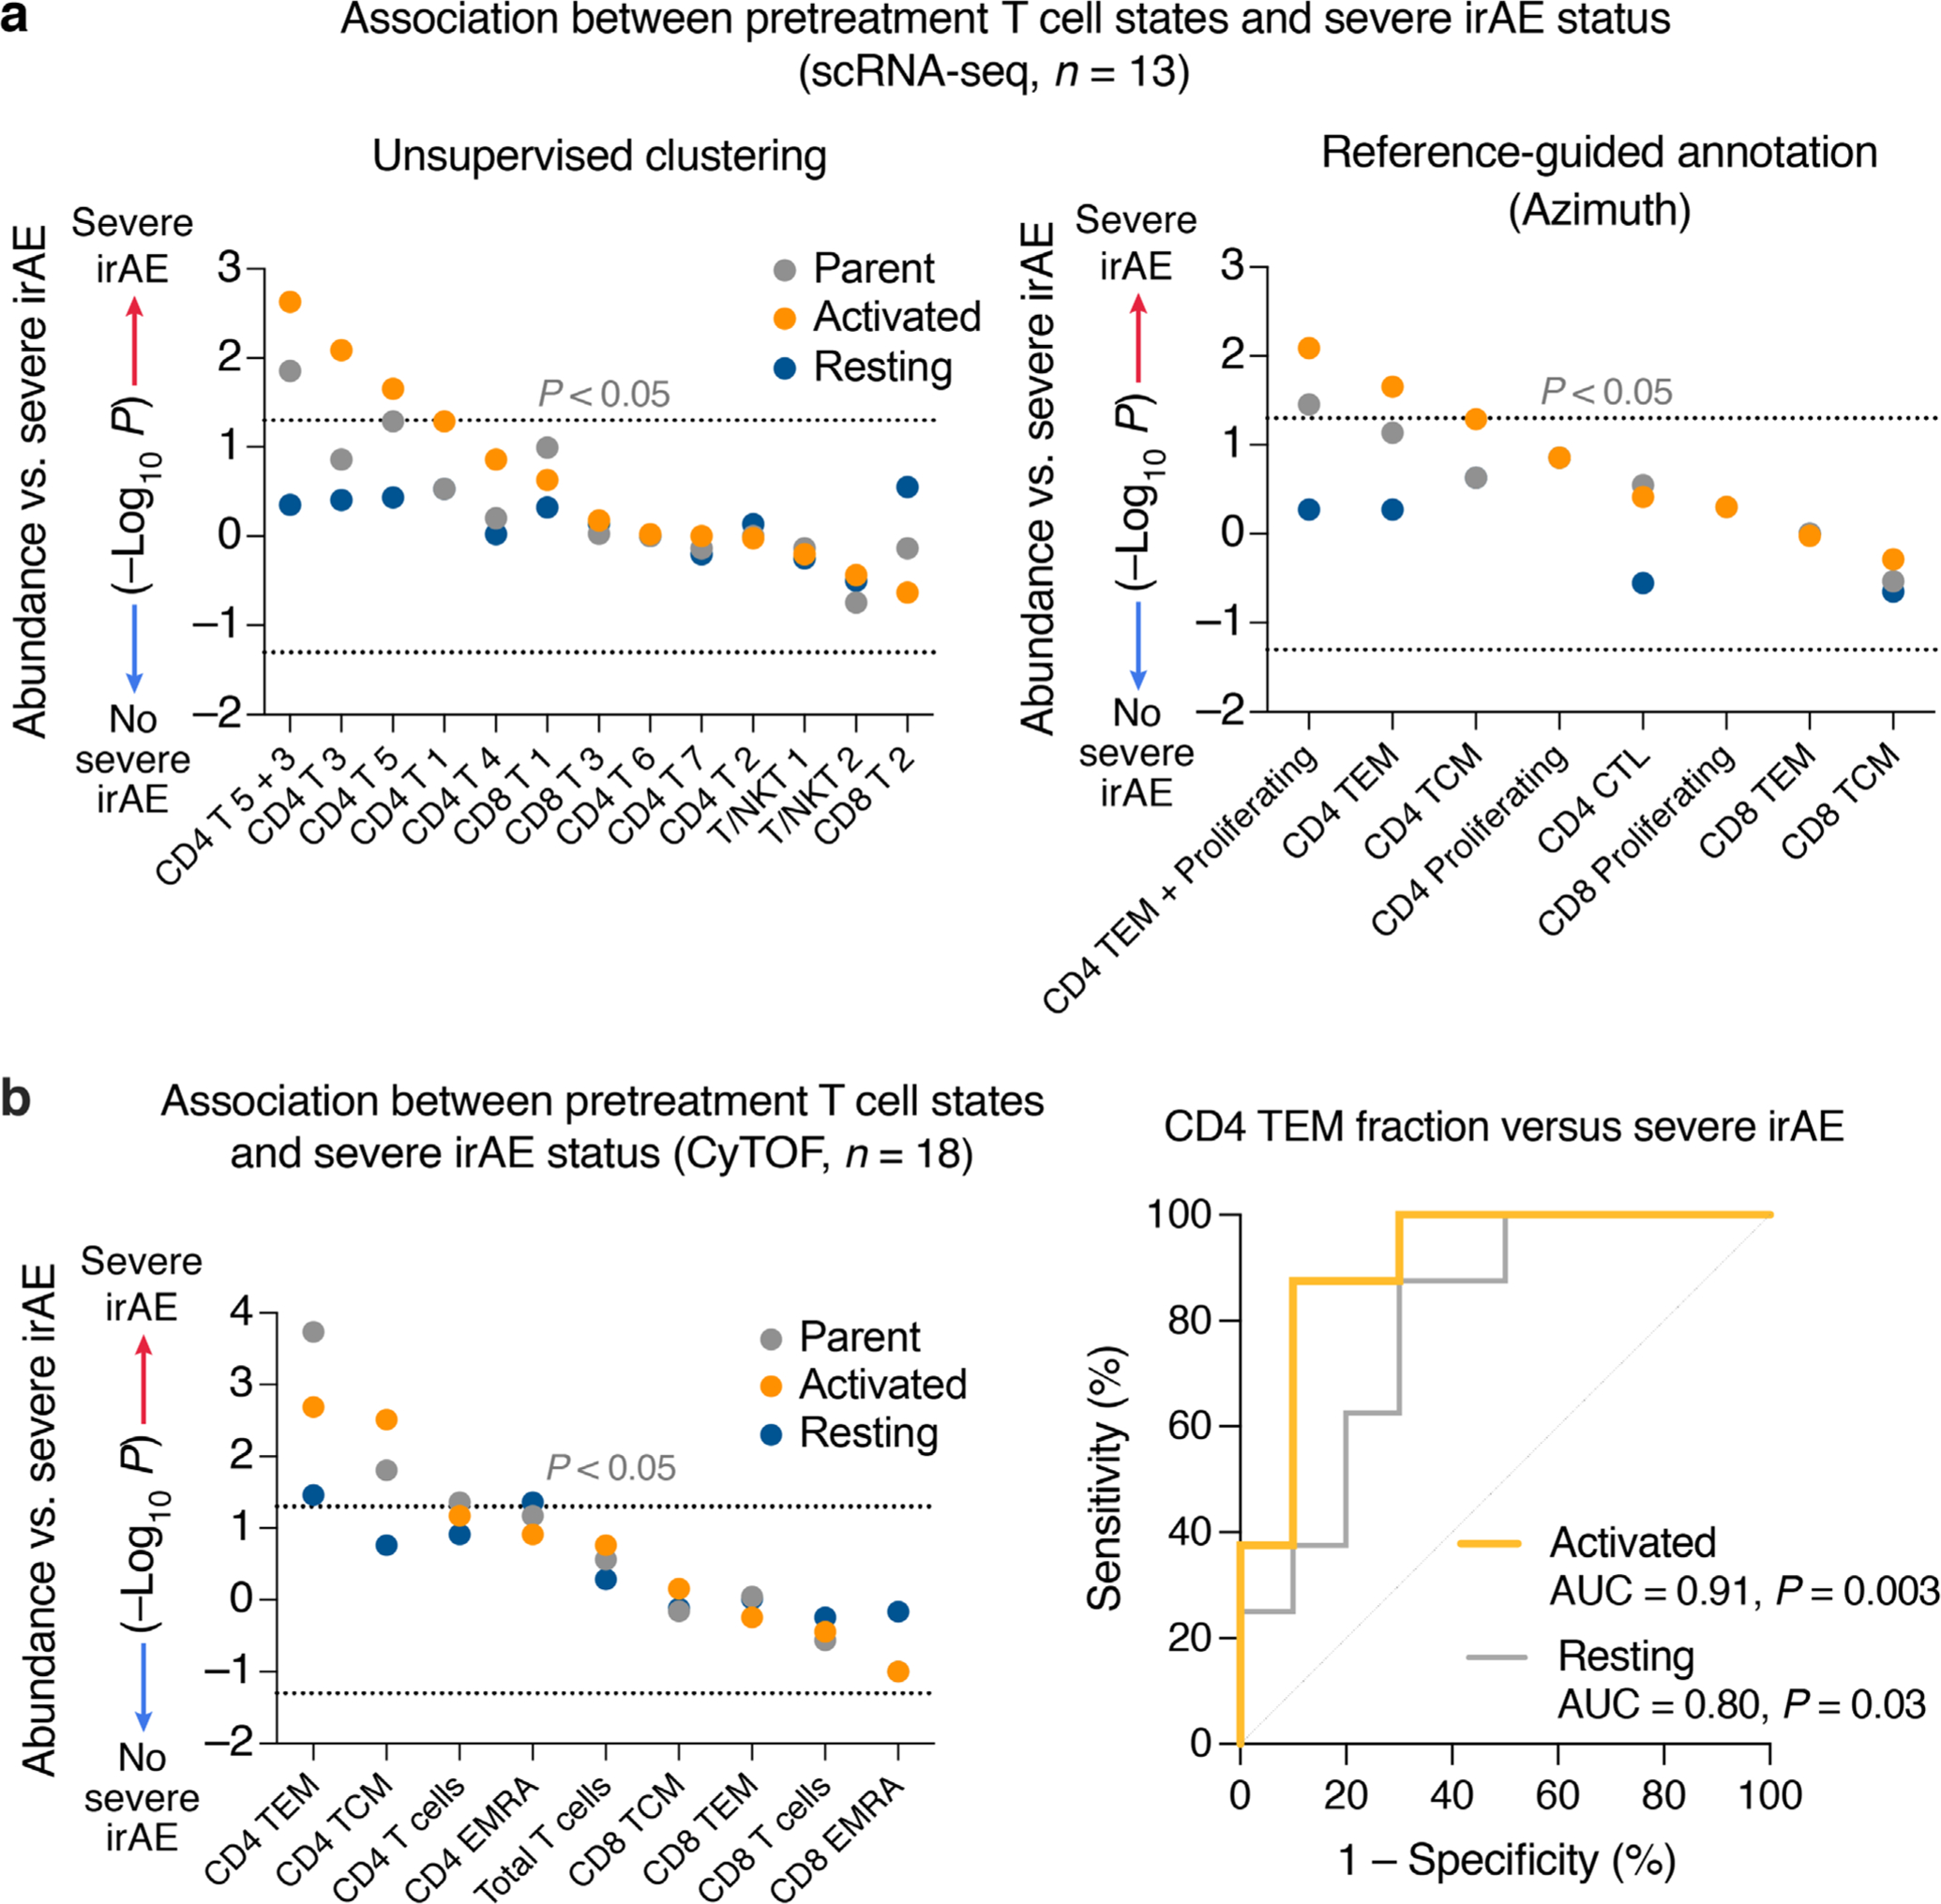
Extended Data Fig. 3 |. Analysis of activated, resting, and parental T cell subsets in relation to severe irAE development.

a, Association between severe irAE development and pretreatment levels of T cell states identified by unsupervised clustering (left) and memory-like T cell states identified by Azimuth (right) in 13 PBMC samples profiled by scRNA-seq (Figs. 1 and 3a). Activated cells were defined as those expressing HLA-DX or MKI67 (CPM > 0); resting cells were defined by the absence of HLA-DX and MKI67 expression (CPM = 0). b, Left: Association between severe irAE development and pretreatment levels of memory T cell subsets, total CD4 and CD8 T cells, and total T cells quantified by CyTOF, for all 18 patients analyzed in the single-cell discovery cohort (Figs. 1 and 2a). Activated phenotypes were defined as CD38+ or HLA-DR+ or Ki67+. Resting phenotypes were defined as CD38−HLA-DR−Ki67−. Right: ROC plot showing the performance of activated and resting CD4 TEM subsets (left panel) for predicting severe irAE development. Cell fractions were assessed relative to total PBMC content. Statistical significance in a, b was determined by a two-sided, unpaired Wilcoxon rank sum test and nominal −log10 P-values are displayed. −log10 P-values were further multiplied by −1 for associations with no severe irAE. See also Supplementary Table 6.
