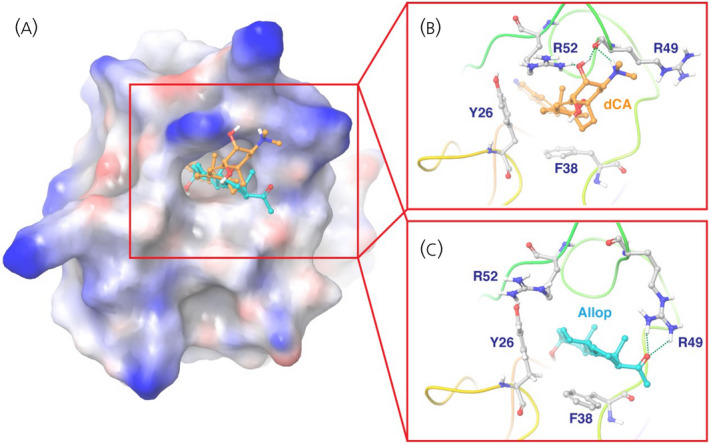
FIGURE 7.

Molecular docking of didehydro‐cortistatin A (dCA) (orange) and allopregnanolone (cyan) in HIV Tat (Protein Data Bank: 1K5K). Tat is shown in a surface representation in the zoom‐out view (A) and in a ribbon representation in the zoom‐in view (B, C). Key residues of Tat for ligand binding are shown in stick representation
