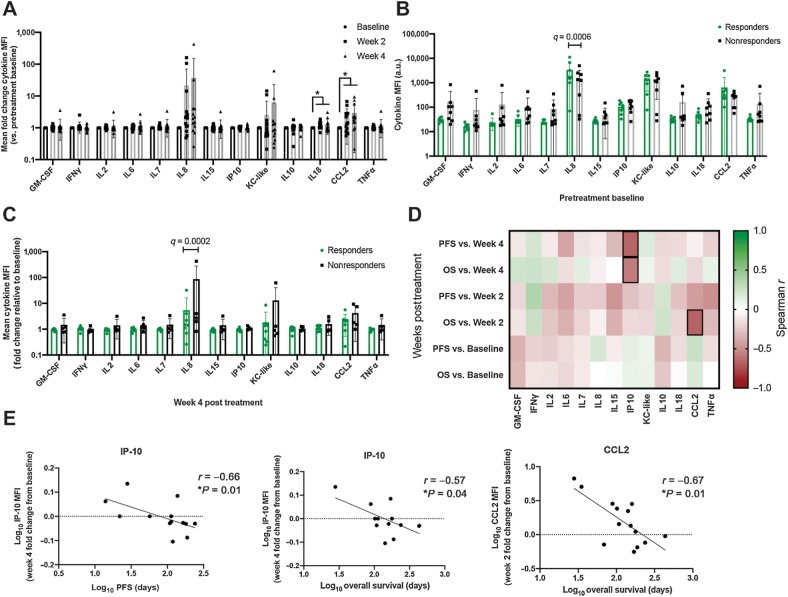
Figure 5.
Multiplex cytokine profiling of patient peripheral blood for evaluation of immune correlates associated with response to losartan therapy. A, Mean fold change in peripheral blood cytokine median fluorescence intensity (MFI) at 2 and 4 weeks post-losartan treatment for evaluable patients in the high-dose losartan (10 mg/kg) cohort (n = 13–16 dogs/timepoint). P value calculated by mixed-effects analysis with Benjamini, Krieger, and Yekutieli multicomparison correction (FDR q value). *, q = 0.01 (IL18 week-2 vs. baseline), q = 0.07 (IL18 week-4 vs. baseline), q = 0.03 (CCL2 week-2 and week-4 vs. baseline). B, Comparison of baseline pretreatment mean peripheral blood cytokine MFI values in responders (dogs experiencing clinical benefit, n = 8) versus nonresponders (n = 8) in the high-dose losartan (10 mg/kg) cohort. P value calculated by multiple unpaired t test with Benjamini, Krieger, and Yekutieli multicomparison correction, FDR q = 0.0006 (IL8). C, Mean fold change, relative to pretreatment baseline, in peripheral blood cytokine MFI values at 4 weeks post-losartan treatment, in responders (dogs experiencing clinical benefit, n = 8) versus nonresponders (n = 5) in the high-dose losartan (10 mg/kg) cohort. P value calculated by multiple unpaired t test with Benjamini, Krieger, and Yekutieli multicomparison correction, FDR q = 0.0002 (IL8). D, Correlation matrix between peripheral blood cytokine levels at baseline, week 2, and week 4 posttreatment with patient PFS and overall survival. Spearman r values, green = 1, or strong positive correlation; red = −1 or strong negative correlation; white = 0, no correlation. Outlined boxes indicate Spearman P < 0.05. E, Individual Spearman correlation plots for those cytokines significantly correlated with clinical outcome, as outlined in D.

