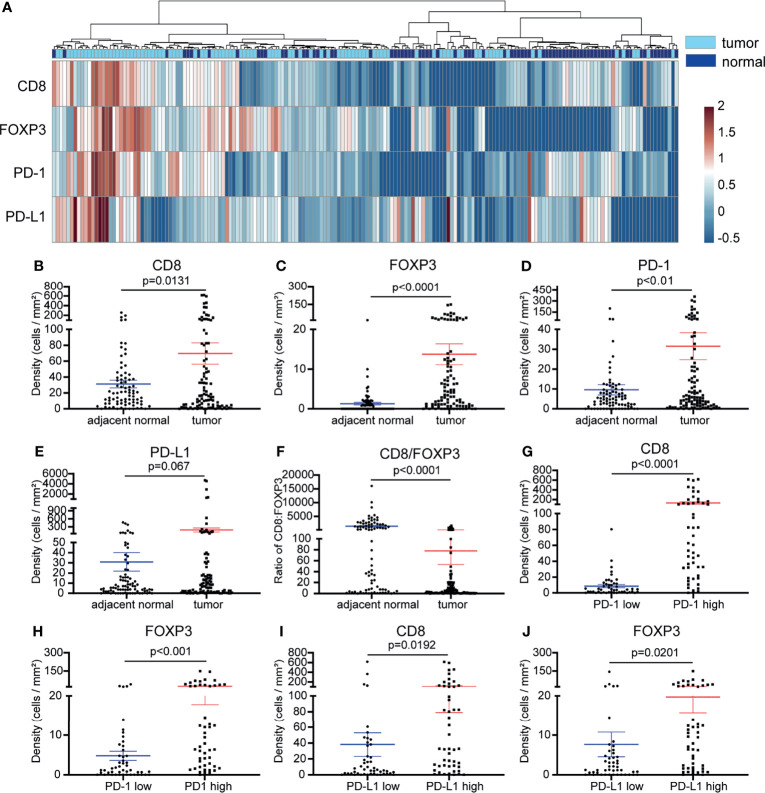
Figure 2.
Comparison of the cell densities of CD8+ T cells, FOXP3+ cells, PD-1+ cells and PD-L1+ cells in tumor and adjacent normal tissues and the relationships between these markers. (A) Heatmap representation of the hierarchical clustering showing the density levels of CD8+, FOXP3+, PD-1+ and PD-L1+ cells and a dendrogram of the results of the unsupervised hierarchical clustering of tumors and adjacent normal samples. (B–D) Compared with those in adjacent normal samples, the densities of CD8+ cells, FOXP3+ Treg cells, and PD-1+ cells in tumor samples were significantly increased (p <0.01-0.0001). (E) Compared with that in adjacent normal tissues, the expression of PD-L1 was inclined to increase in tumor tissues (p =0.067). (F) Compared with that in adjacent normal tissues, the ratio of CD8/FOXP3 in tumor tissues was significantly reduced (p <0.0001). (G–J) The CD8+ T cell and FOXP3+ Treg cell densities were significantly higher in NSCLC tissues with high PD-1+ cell density (G, H) and in the PD-L1 high expression group (I, J) (p < 0.05-0.0001). Error bars represent the SEM.

