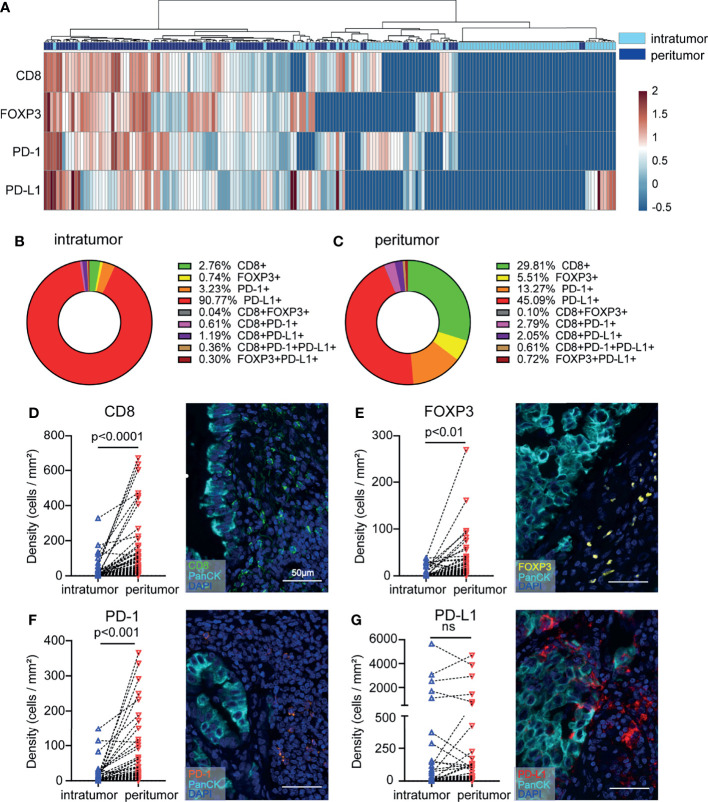
Figure 3.
NSCLC tissue samples display increased infiltration of heterogeneous T cell subpopulations in the peritumoral subregion. (A) Heatmap representation of the results of the hierarchical clustering showing the densities of CD8+, FOXP3+, PD-1+, and PD-L1+ cells and a dendrogram of the results of the unsupervised hierarchical clustering of peritumoral and intratumoral tissues. (B, C) The distribution of each immune cell subpopulation in peritumoral and intratumoral tissues. (D–G) Differences in immune cell density according to the sampling strategy. The y-axis represents each immune cell density. The x-axis of each point is labeled with the peritumoral and intratumoral sampling strategy. Lines connect the two points of the densities of each marker relating to the same tumor. Representative images are shown on the right. Paired t tests were used to assess differences, and p values are reported.

