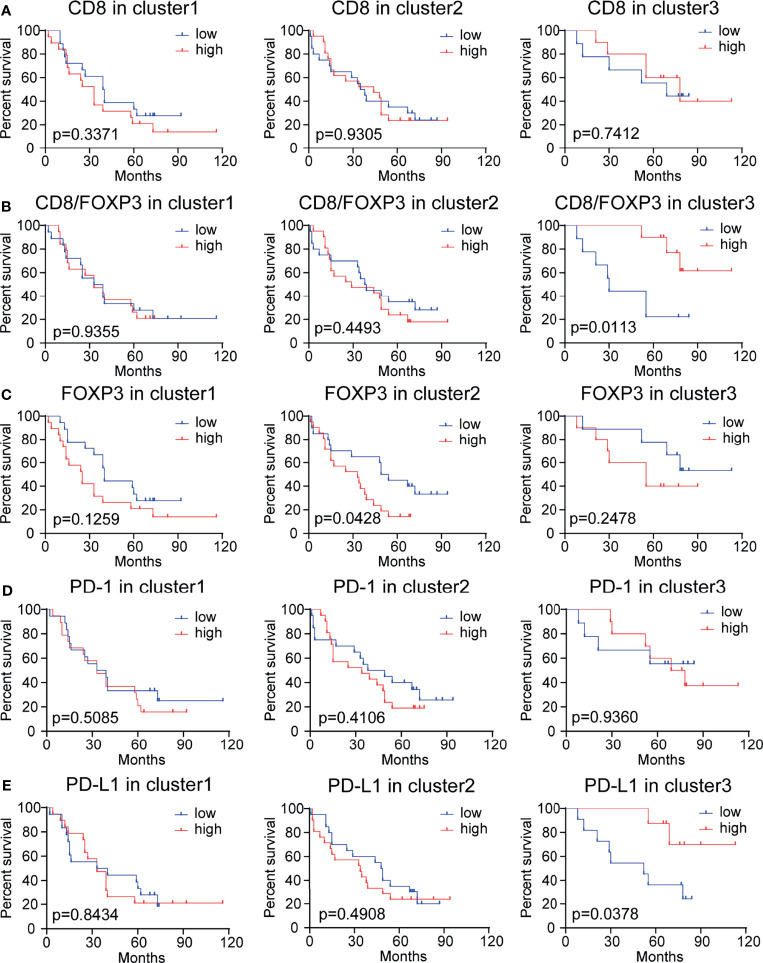
Figure 5.
Kaplan–Meier analysis of the overall survival rate (OS) in subgroups of patients stratified based on CD8, CD8/FOXP3, FOXP3, PD-1, and PD-L1 expression levels. (A) Survival results for 97 NSCLC patients with different CD8+ cell densities. These patients were sorted into 3 clusters generated based on the CD8/FOXP3 ratio and PD-1 and PD-L1 expression levels. Patients with high or low CD8 expression had no significant difference in OS (p >0.05). (B) Survival results for 97 NSCLC patients with different CD8/FOXP3 ratios. The survival rate of patients with higher CD8/FOXP3 expression in cluster 3 was significantly increased (p <0.05). (C) Survival results for 97 NSCLC patients with different FOXP3 expression levels. Patients with higher FOXP3 expression in cluster 3 had poor survival (p <0.05). (D) Survival results for patients with different PD-1 expression levels: no difference was observed (p>0.05). (E) Survival outcome for 97 NSCLC patients with different PD-L1 expression levels. The survival rate of patients with a high PD-L1 expression level in cluster 3 was significantly increased (p<0.05). The median cutoff value was used to distinguish high density from low density. A log-rank test was used to perform statistical analysis.

