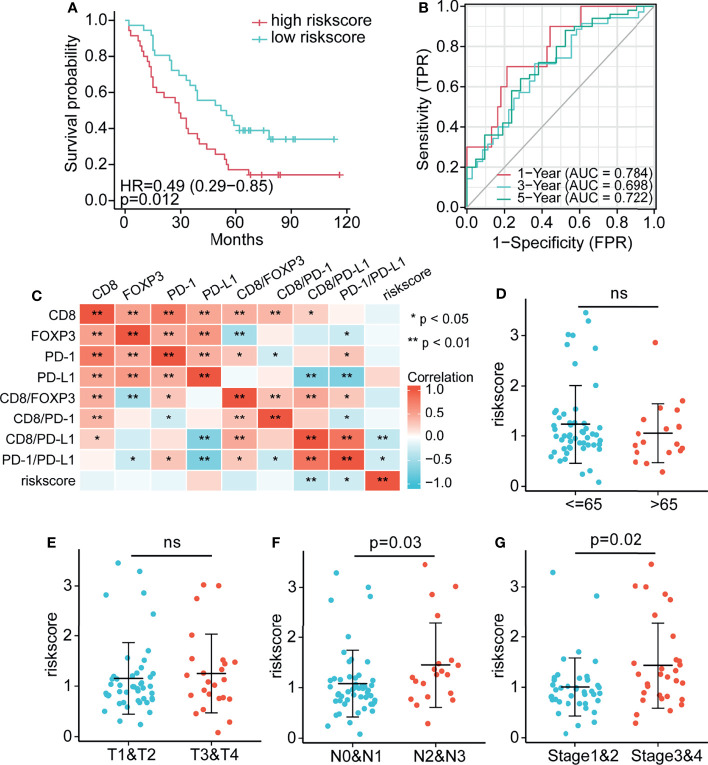
Figure 7.
Establishment of the risk score and assessment of its prognostic significance (A) Compared with the high risk score group, the low risk score group had significantly better survival. (B) AUC values for 7-factor predictions models. (C) Heatmap comparing immune cell abundance with the risk score. (D–G) The association between clinical information, (D) age, (E) tumor, (F) lymph node, and (G) AJCC stage and the risk score. * p < 0.05, ** p < 0.01, ns p > 0.05.

