Fig. 1.

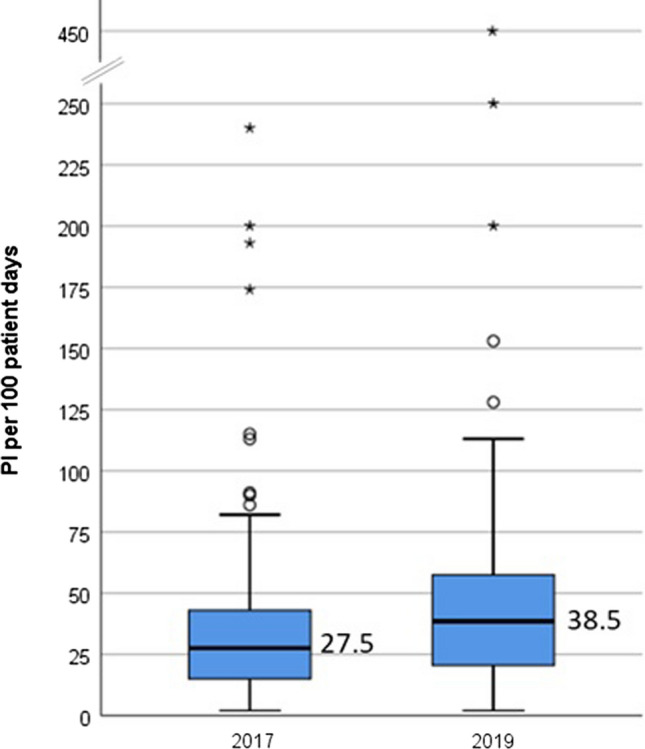
Intervention rates, expressed as PI per 100 patient days in IW-2017 and IW-2019 (boxes represent the 25th to 75th percentiles, whiskers: lowest and highest non-extrem values, circles: mild outliers, asterixes: extreme outliers)

Intervention rates, expressed as PI per 100 patient days in IW-2017 and IW-2019 (boxes represent the 25th to 75th percentiles, whiskers: lowest and highest non-extrem values, circles: mild outliers, asterixes: extreme outliers)