Fig. 8.
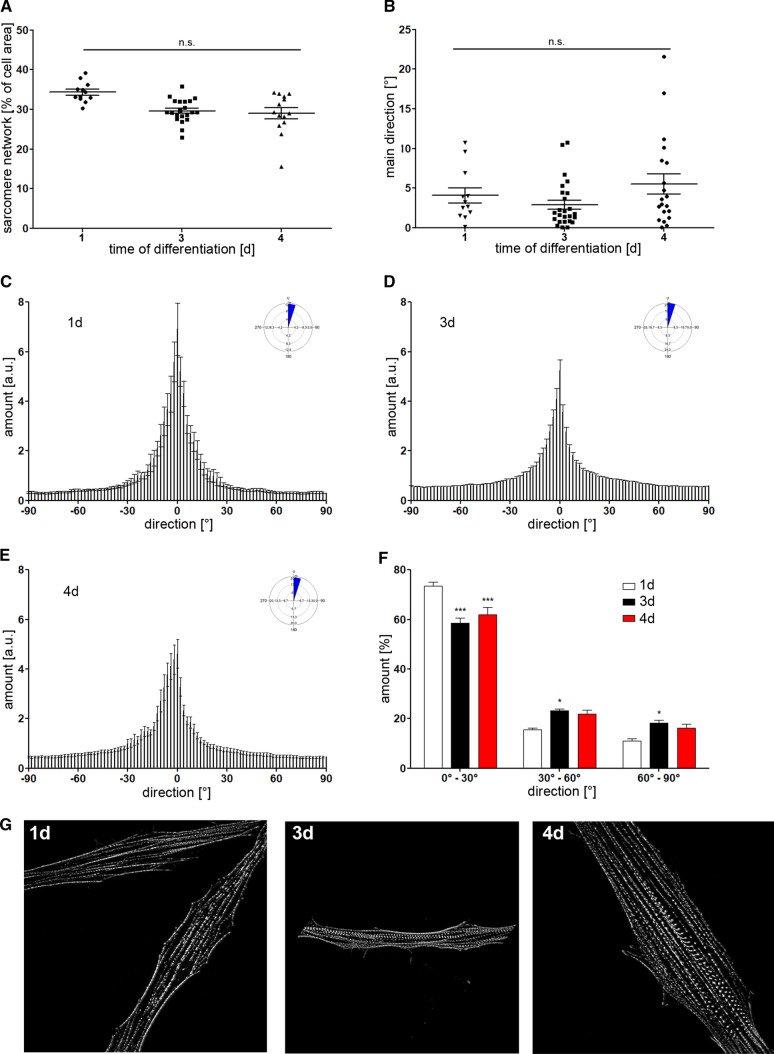
Evaluation of sarcomere maturation in human skeletal muscle cells. A, B Density of the sarcomere network and main orientation was monitored during differentiation of human skeletal muscle cells (day 1, 3 and 4). C–E Histograms rose diagrams of sarcomere orientation demonstrate the distribution of filaments. Most sarcomere structures were found to align parallel to the longitudinal cell axis. F Prolonged differentiation leads to a reduced amount of structures between 0°–30°, while the number of sarcomere filaments with improved orientation (30°–90°) was increased. G Representative images of α-actinin labeled skeletal muscle cells at different timepoints of differentiation. Statistical analysis was performed using Watson–Williams Test for filament orientation and one-way and two-way ANOVA, followed by Dunett’s post hoc test, n = 12–21, *p < 0.05, ***p < 0.001 compared to 1d

