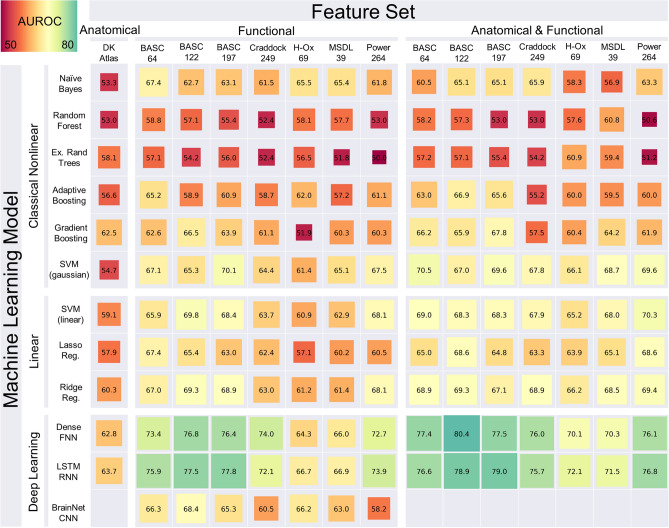
Figure 1.
Performance of classifiers predicting the diagnosis of ASD versus TD. Performance is measured as the area under the ROC curve (AUROC) on held-out test data from IMPAC. Greener colors and larger boxes indicate higher performance. Note that BrainNetCNN can only be applied to fMRI data. Rows indicate the type of machine learning model used while columns indicate the feature set (volumetry, connectivity based on a brain-atlas parcellation, or both) and the atlas parcellation name. Models were further broken into linear, nonlinear, and deep learning methods. Features were grouped into anatomical, functional, and combined anatomical and functional features. See “Methods” for further detail. DK Desikan–Killiany atlas, Ex. Rand Trees extremely random trees, SVM (Gaussian) support vector machine with a Gaussian kernel, SVM (linear) SVM with linear kernel, lasso reg. logistic regression with L1 penalization, ridge reg. logistic regression with L2 regularization, Dense FNN dense feedforward neural network, LSTM RNN bidirectional long short term memory recurrent neural network, BrainNet CNN BrainNet convolutional network63,64.

