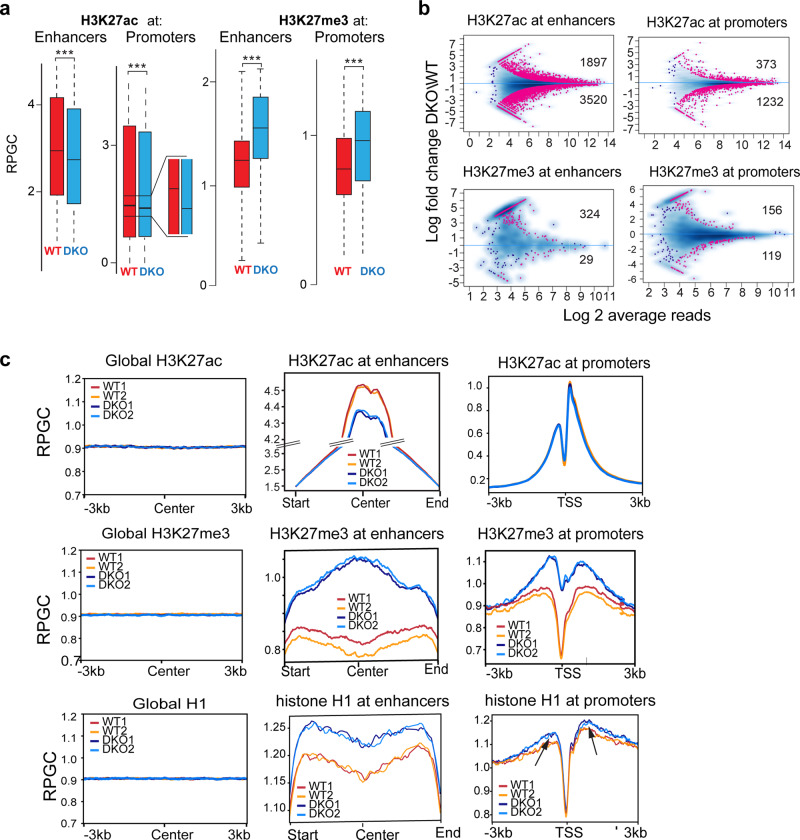
Fig. 3. Loss of HMGN alters H3K27modifications and H1 occupancy at chromatin regulatory sites of MEFs.
a Box plot showing decreased H3K27ac but increased H3K27me3 levels at enhancers and promoters of DKO mice. b MA plots showing differences between WT and DKO cells in H3K27ac or H3K27me3 levels at enhancers and promoters. Statistically significant differences (FDR < 0.05) are shown in red. Blue dots and blue density cloud represents all points corresponding to the nonchanging regions. c Aggregate plots showing the distribution of the average H3K27ac, H3K27me3 and histone H1 levels in WT and DKO MEFs. Left panels: throughout the genome (regulatory sites subtracted). “Center” indicates a location of the middle point of each 6kbp bin. Center panels: at enhancers. In these panels all cellular enhancers were aligned at their center. RPGC: reads per genomic coverage. Right panels: at promoters, Arrows point to promoter regions where H1 occupancy differs between WT and DKO cells. All ChIP analyses from two biological replicates. Regulatory sites identification is based on UCSC genome annotation (NCBI37/mm9).

