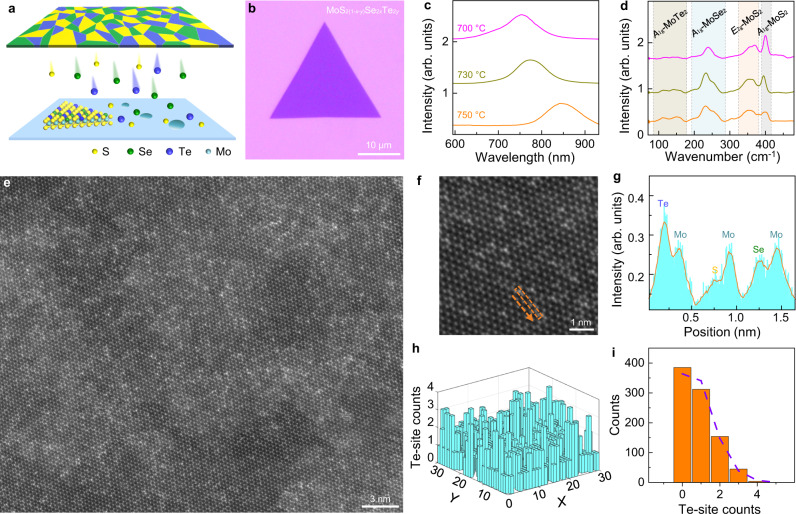
Fig. 3. Growth and characterizations of quaternary TMD alloy.
a Schematic diagram of quaternary alloy growth using a compressed plate mixed with chalcogenide powders of ZnS, ZnSe, and ZnTe. b Optical image of MoS2(1-x-y)Se2xTe2y domain on SiO2/Si substrate. c, d PL (c) and Raman (d) spectra of the MoS2(1-x-y)Se2xTe2y sample grown at different temperatures. As the growth temperature increased, the PL peak position showed a clear red shift. The intensity of MoS2-like E2g (~380 cm−1) and A1g (~400 cm−1) was reduced while the MoTe2-like A1g (~150 cm−1) increased and MoSe2-like A1g (~240 cm−1) increased first and then reduced. The shaded areas are added for clarity. e, f STEM images of the MoS2(1-x-y)Se2xTe2y, demonstrating the high crystallinity of quaternary alloy. g Intensity profile along the labeled orange dotted box in (f), which highlights the occupancies of Mo, S, Se, and Te sites. h The Te-site distribution in a 32 × 32 nm2 STEM image of the quaternary alloy. The image was divided into 30 × 30 parts. i The corresponding statistical histogram of Te-site counts in each parts of the image. It shows a well binomial distribution feature (purple dotted line), revealing the random distribution of Te atoms.

