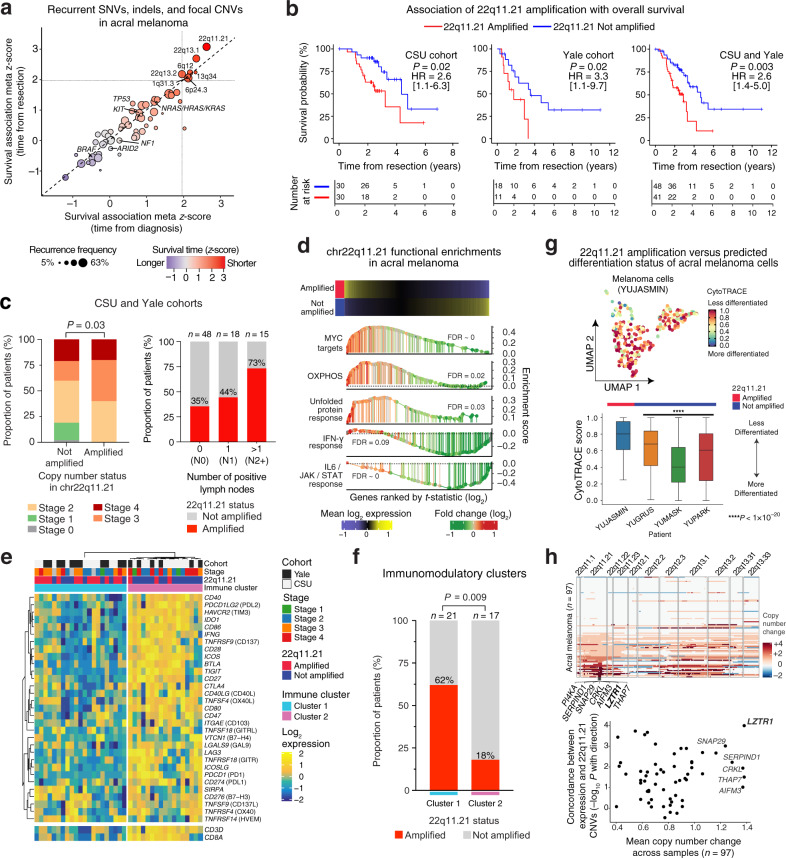
Fig. 2. Focal amplifications in 22q11.21 are linked to shorter survival time, regional metastasis, and depletion of immunomodulatory programs in acral melanoma.
a Association between recurrent somatic alterations and overall survival in acral melanoma. Shown are genes with a nonsynonymous mutation frequency ≥5% in either melanoma subtype and focal copy number events with ≥10% recurrence frequency in each cohort. |Z | > 1.96 is P < 0.05. b Overall survival of acral melanoma patients stratified by 22q11.21 amplification status. Significance was assessed with a two-sided log-rank test. HR hazard ratio. 95% HR confidence intervals are shown in brackets. c Left: Acral melanoma stage versus 22q11.21 amplification status. Significance was evaluated by a Chi-square test. Right: Fraction of 22q11.21-amplified melanomas versus lymph node status. d Hallmark pathways enriched in 22q11.21-amplified vs. non-amplified acral melanomas, as determined by pre-ranked gene set enrichment analysis. OXPHOS oxidative phosphorylation. e Hierarchical clustering of 31 immunomodulatory genes (average linkage with Euclidean distance) in acral melanomas. CD3D and CD8A are lineage markers for T cells and CD8 T cells, respectively. f Frequency of 22q11.21-amplified acral melanomas in immune clusters 1 and 2 from e. Significance was determined by Fisher’s exact test. g Top: UMAP showing CytoTRACE-inferred differentiation scores of acral melanoma cells from a 22q11.21-amplified specimen (YUJASMIN). Bottom: CytoTRACE scores (acral melanoma cells) in amplified vs. non-amplified tumors. Box center lines, bounds of the box, and whiskers indicate medians, first and third quartiles, and minimum and maximum values within 1.5×IQR (interquartile range) of the box limits, respectively. Significance was determined using a two-sided, unpaired Wilcoxon rank-sum test relative to YUJASMIN (n = 312 cells) for YUGRUS (n = 3786 cells, P = 1.21 × 10⁻²²), YUMASK (n = 15,006 cells, P = 4.38 × 10–87), and YUPARK (n = 8141 cells, P = 1.06 × 10⁻³⁵). h Top: CNVs within the 22q arm of 97 acral melanomas. Genes within the minimum region of focal amplification in 22q11.21 are indicated. Columns indicate genes ordered by location. Bottom: Mean gene-level copy number change in 97 acral melanomas versus the concordance between expression and copy number for each gene. The latter is expressed as the –log10 p value of a two-sided, unpaired Wilcoxon rank-sum test. Negative associations with amplification status were multiplied by –1. Only genes within the 22q11.21 focal amplification identified by GISTIC are shown (n = 24; Supplementary Table 6). Source data are provided as a Source Data file.

