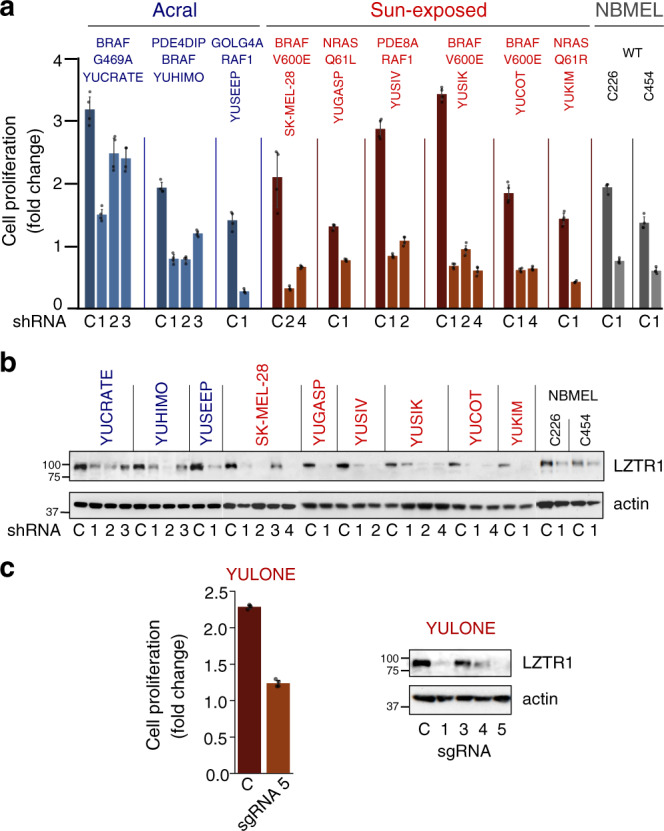
Fig. 3. Cell proliferation in response to the suppression of LZTR1.

a Impact of LZTR1 knockdown on cell proliferation in nine primary melanoma cell lines and two normal human melanocyte lines (NBMEL). Key mutations are indicated (Supplementary Table 7). Bar plots depict mean fold change between the 3rd and 6th day after infection with LZTR1 shRNA (numbered), as compared to control (scrambled) shRNA (C) with error bars indicating 95% confidence intervals. b Western blots with anti-LZTR1 antibodies showing the efficacy of LZTR1 knockdown, related to panel a. This experiment was reproduced twice with LZTR1 shRNA 1 and shRNA 2, compared to control. c Cell proliferation (left) and LZTR1 expression (right) of a sun-exposed melanoma cell line that lost one LZTR1 allele in response to genomic modification by different CRISPR-Cas9 sgRNAs targeting LZTR1. Bar plots depict fold change between the 3rd and 6th day after infection with sgRNA 5. Data represent one experiment. Bars in a, c represent the mean of triplicate wells with error bars indicating 95% confidence intervals. Actin levels in b and c show protein loading. Cell lines are indicated above all plots in a–c and colored according to their origin: acral melanoma (blue), sun-exposed melanoma (red), normal melanocyte (gray). NBMEL newborn melanocytes, WT wildtype. Source data are provided as a Source Data file.
