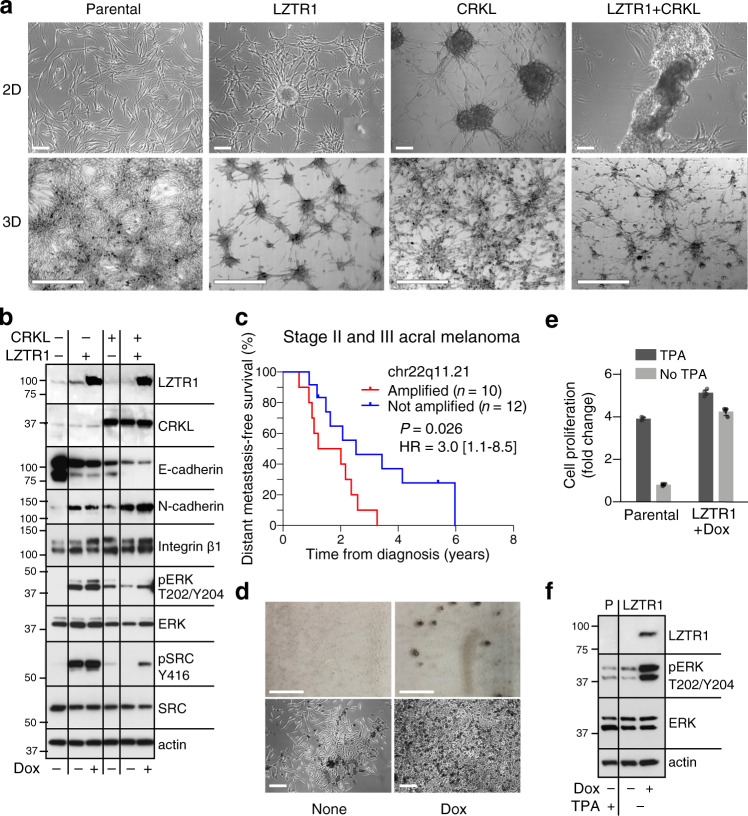
Fig. 6. Overexpression of LZTR1 and CRKL confer properties consistent with malignant cell transformation and metastasis initiation.
a Morphological changes and spheroid formations in early passage normal human melanocytes (NBMEL C1220) overexpressing LZTR1 and/or CRKL. Top: Phase-contrast images of parental and infected cells in 2D culture. LZTR1 images were taken after 2 days of induction with doxycycline (200 ng/ml), CRKL after 3 days of infection with PLX304-CRKL and LZTR1 + CRKL after 6 days infection of LZTR1 melanocytes with PLX304-CRKL and 3 days stimulation with doxycycline. Non-induced LZTR1 cells grew as a monolayer, as seen for the parental non-transformed melanocytes (Parental). Scale bar = 100 µm. Bottom: 3D cultures of melanocytes seeded in 0.5% collagen for 3 days. LZTR1 and CRKL, both alone and in combination, induced aggregation and multicellular spheroids. Scale bar = 500 µm. b Western blot showing changes in normal human melanocytes overexpressing LZTR1, CRKL, or both (top two lanes) compared to parental (–). Cells were harvested after incubation in regular medium, or medium supplemented with doxycycline for 2 days when applicable (Dox, 200 ng/ml). Of note, an increase in LZTR1 produced by basal promoter activity was sufficient to induce constitutive MAPK and SRC activities. Actin levels show protein loading. c Differences in distant metastasis-free survival (DMFS) between acral melanoma patients stratified by 22q11.21 amplification status. Patients with stage II or III disease at diagnosis with available DMFS data were shown (Yale cohort). Statistical significance was assessed by a two-sided log-rank test. HR hazard ratio. 95% HR confidence interval is shown in brackets. d 2D cultures of spontaneously immortalized mouse melanocytes (C57BL) forming colonies in the absence of TPA in response to LZTR1 (Dox). Dark pigmented colonies are seen without magnification (top) and by phase-contrast microscopy (bottom). Scale bar = 100 µm (top) and 200 µm (bottom). e Proliferation of parental and LZTR1-transformed C57BL mouse melanocytes. Bar plots represent the mean fold change of n = 4 replicates with 95% confidence intervals indicated. f Western blots displaying LZTR1 expression and MAPK activation (pERK) in TPA-starved (–) mouse melanocytes in response to doxycycline (+, 200 ng/ml), compared to parental, non-transformed cells (P). Panel a represents one of three experiments. Source data are provided as a Source Data file.

