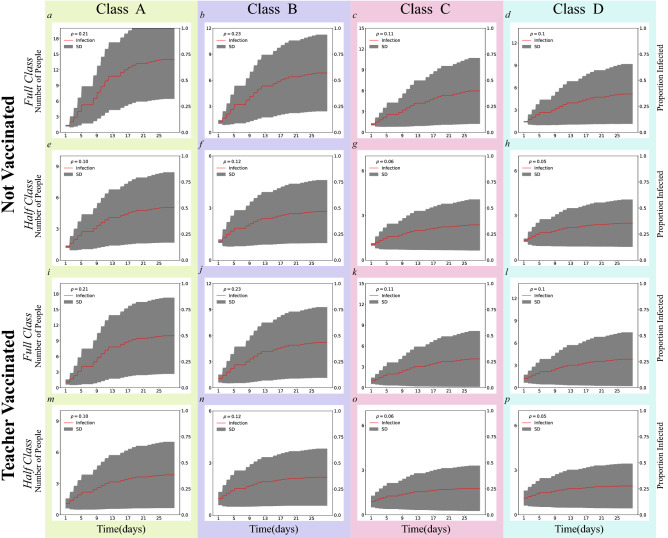
Figure 3.
SARS-CoV-2 Infection over Time. The proportion (right) and total number (left) of infections over time in days . Trajectories are simulated for four classes for the full versus half-sized scenarios and not vaccinated versus teacher-vaccinated scenarios. The red curves and grey areas represent the mean and standard deviation of the proportion/total number of infections for all observations, respectively. ’s in each legend represent the classroom densities in the unit of people per .

