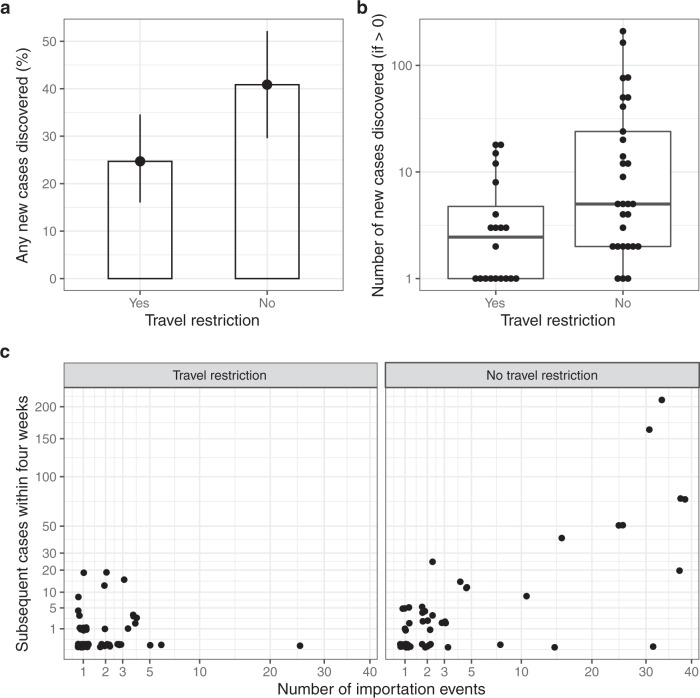
Fig. 4. The effect of travel restrictions (14-day quarantine) on the subsequent spread of likely imported cases as determined by genomics.
a The proportion of imported cases with any matching genome detected over the four weeks following index test result. Error bars correspond to bootstrapped confidence intervals, n = 81 and 71. b The number of genomes matching the index case, with zeros excluded. The midline of the boxplot represents the median value; the lower limit of the box represents the first quartile (25th percentile), and the upper limit of the box represents the third quartile (75th percentile); the whiskers (upper and lower) extend to the largest and smallest value from the box, no further than 1.5*IQR from the box. a, b Compare countries with travel restriction guidance (closed ‘travel-corridors’) in place and those without (open ‘travel-corridors’). c The number of cases and number of importation events for each imported genome, stratified by whether the index case had returned from a country with a travel restriction in place.

