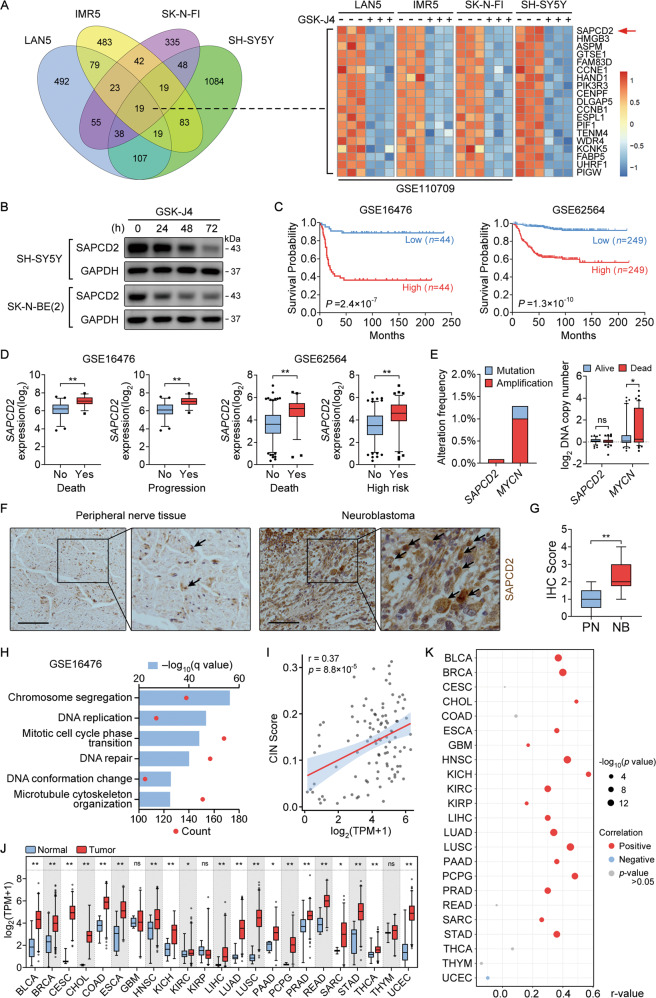
Fig. 1. Identification of SAPCD2 as a prognostic factor associated with NB progression.
A Venn diagram and heatmap revealing the identification of downregulated genes in GSK-J4-treated NB cell lines using the public dataset (GSE110709) and our previous microarray study (GSE180601). B Western blot indicating the expression of SAPCD2 in SH-SY5Y treated with 0.5 μM GSK-J4 and SK-N-BE(2) treated with 1 μM GSK-J4 for time points as indicated. C. Kaplan–Meier curves indicate the survival of NB patients with high or low SAPCD2 expression. D Public datasets reveal the differential expression of SAPCD2 transcript in NB tissues with different status of death, progression, or risk of progression. E Public database revealing the copy number and genetic variants of MYCN and SAPCD2 gene in NB tissues with different status of death. F, G Representative immunohistochemical staining and immunohistochemistry scores revealing SAPCD2 expression in NB tissues and normal peripheral nerve tissues (PT). Scale bars, 100 μm. H GO analysis of the top 50% of genes (n = 2311 genes) that tightly co-expressed with SAPCD2. FDR <0.05. I Scatter plot shows a positive significant correlation between SAPCD2 transcript levels and CIN scores in NB tissues. J SAPCD2 expression levels relative to the indicated tumor types and normal samples from the TCGA dataset. K Bubble plot showing levels of correlation between SAPCD2 transcript levels and CIN scores in indicated tumor types from the TCGA dataset. Log-rank test for analysis in C; unpaired two-sided t-test in D, E, G, and J, data were shown as mean ± SD (error bars); Pearson’s correlation coefficient in I and K. ns, not significant. Data were representative of three independent experiments in B.

