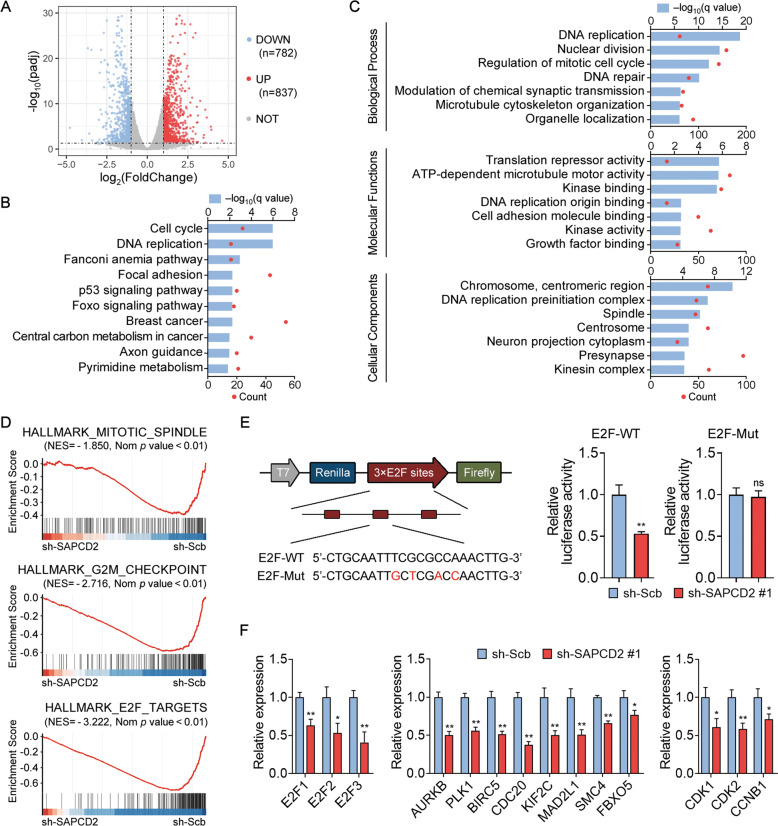
Fig. 3. Transcriptome analysis of SAPCD2-dependent regulation.
A Volcano plot of all expressed genes is shown to identify DEGs obtained from RNA-seq data in SAPCD2-knockdown SK-N-BE(2) cells with abs(log2(fold change)) >1 and adjusted p value <0.05. B, C KEGG pathway analysis (B) and GO analysis (C) for DEGs. D Enrichment plots generated from GSEA hallmark gene set using DEGs upon SAPCD2-knockdown. NES normalized enrichment score. NOM p value, adjusted p value. E Activity of the dual-luciferase reporter vector containing WT or mutant E2F-binding motifs that were transfected into SK-N-BE(2) cells transfected with sh-Scb or sh-SAPCD2. F qPCR analysis of mRNA levels for the indicated E2F transcription activators, E2F target genes, and cell cycle-related genes in SK-N-BE(2) cells transfected with sh-Scb or sh-SAPCD2. Unpaired two-sided t-test for analysis in E–F, data were shown as mean ± SD (error bars). ns, not significant. Data were representative of three independent experiments.

