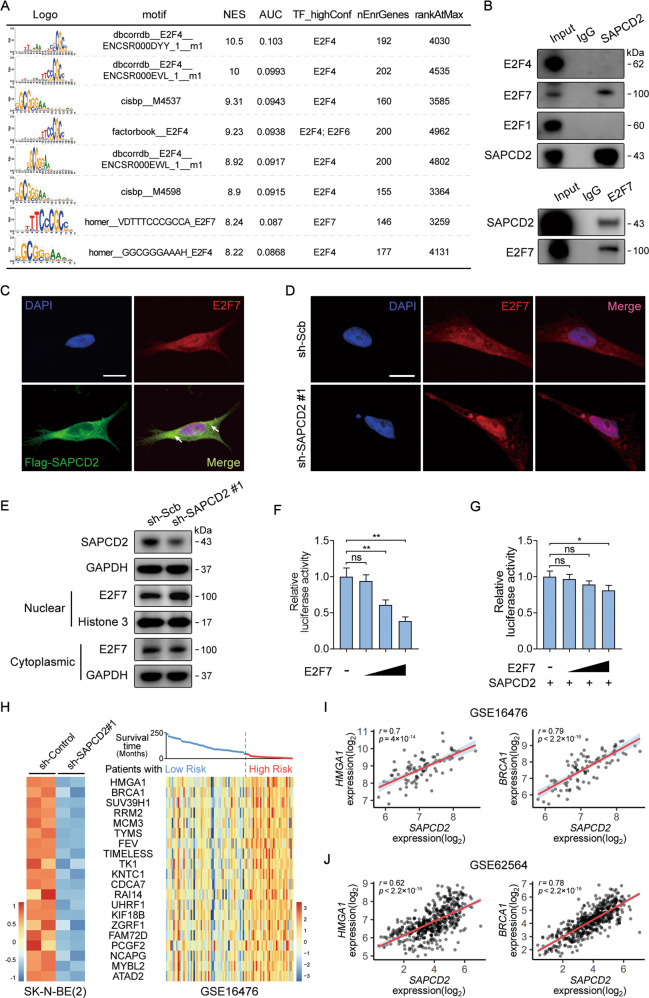
Fig. 4. SAPCD2 alters the subcellular distribution of E2F7 in NB cells.
A Motif enrichment analysis by cisTarget database revealing the potential upstream transcription factors of the downregulated genes in the SAPCD2-knockdown SK-N-BE(2) cells. NES, normalized enrichment score of the motif in the gene set. AUC, area under the curve. TF_highConf, transcription factors annotated to the motif according to the “motifAnnot_highConfCat” dataset. nEnrGenes, Number of genes highly ranked. rankAtMax, Ranking at the maximum enrichment. B Immunoprecipitation of endogenous SAPCD2 or E2F7 in SK-N-BE(2) cells analysed by western blot showing an interaction between SAPCD2 and E2F7. Rabbit IgG was used as a negative control. C Immunofluorescence confocal images showing the interaction between SAPCD2 and E2F7 in SK-N-BE(2) cells stably transfected with FLAG-tagged SAPCD2. Arrow, SAPCD2 appears to be mainly colocalized with E2F7 in the cytoplasm. Scale bars, 10 μm. D, E Immunofluorescence confocal images and western blot showing the subcellular distribution of E2F7 in SK-N-BE(2) cells transfected with sh-Scb or sh-SAPCD2 for 72 h. Scale bars, 10 μm. F, G Activity of E2F luciferase reporter that were co-transfected into 293T cells with increasing amounts of E2F7 expression plasmid (100–500 ng) in the presence or absence of constant amounts (500 ng) of E2F7 expression plasmid. H Heatmap revealing the expression of predicted E2F7-targeted genes obtained from RNA-seq data in SAPCD2-knockdown SK-N-BE(2) cells and public dataset of NB patients with different survival time (GSE16476). I, J Scatter plot showing a positive significant correlation in transcript level between SAPCD2 and HMGA1 or BRCA1 in NB tissues. Unpaired two-sided t-test for analysis in F, G, data were shown as mean ± SD (error bars). ns, not significant. Pearson’s correlation coefficient in I, J. Data were representative of three independent experiments.

