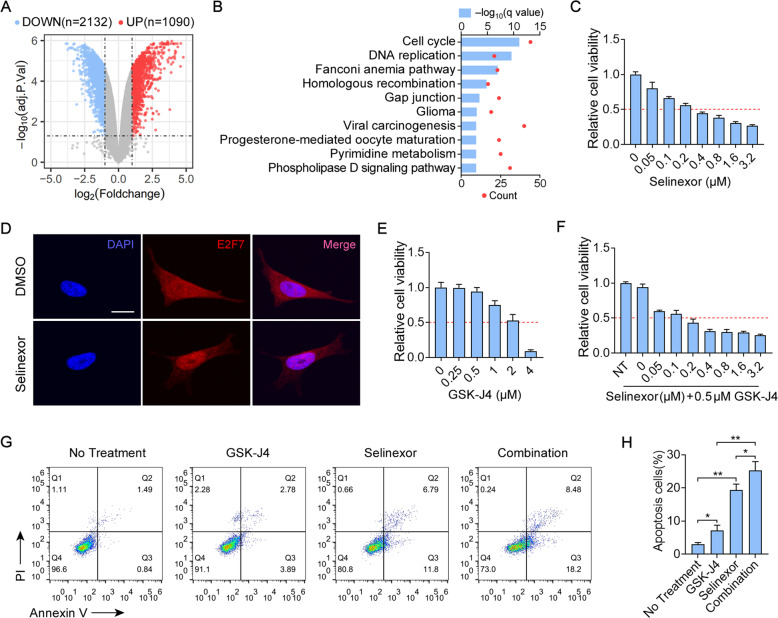
Fig. 5. Selinexor suppresses the growth of NB and combines with GSK-J4 to enhance NB regression.
A Volcano plot of all expressed genes is shown to identify DEGs obtained from microarray study (GSE180601) in Selinexor-treated SK-N-BE(2) cells with abs(log2(fold change)) >1 and adjusted p value <0.05. B KEGG pathway analysis for DEGs. C CCK-8 assays for SK-N-BE(2) cells treated with the indicated concentrations of Selinexor for 72 h. D Immunofluorescence confocal images showing the subcellular distribution of E2F7 in SK-N-BE(2) cells treated with 0.4 μM Selinexor for 24 h. E CCK-8 assays for SK-N-BE(2) cells treated with the indicated concentrations of GSK-J4 for 72 h. F CCK-8 assays for SK-N-BE(2) cells treated with 0 or 0.5 μM GSK-J4 and the indicated concentrations of Selinexor for 72 h. G, H Flow cytometry showing the apoptosis of SK-N-BE(2) cells treated with 0.5 μM GSK-J4, 0.2 μM Selinexor, or the combination for 48 h. Unpaired two-sided t-test for analysis in H, data were shown as mean ± SD (error bars). Data were representative of three independent experiments.

