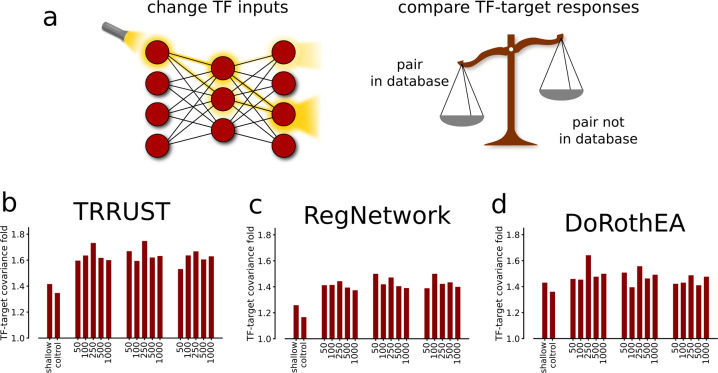
Fig. 3. Node light-up reveals known TF-target associations.
a By applying a light-up analysis, i.e. by changing the input values of each TF independently and subsequently observing the changes on the output layer, we were able to estimate how the TF-to-target mappings corresponded to TF bindings known from literature. We defined the TF-target covariance fold as the median value of the light-ups for the TF-target regulations found in a database divided by the respective backgrounds. b The light-up enrichments for the TF-target associations found in the TRRUST database are shown. Note that the expected value representing no biological relevance between TF-target mapping is 1 and that light-up values are compared to absolute Spearman rank correlation values, labeled ‘control’. We performed the same analysis with RegNetwork (c), and the interactions annotated with top confidence in DoRothEA (d).

