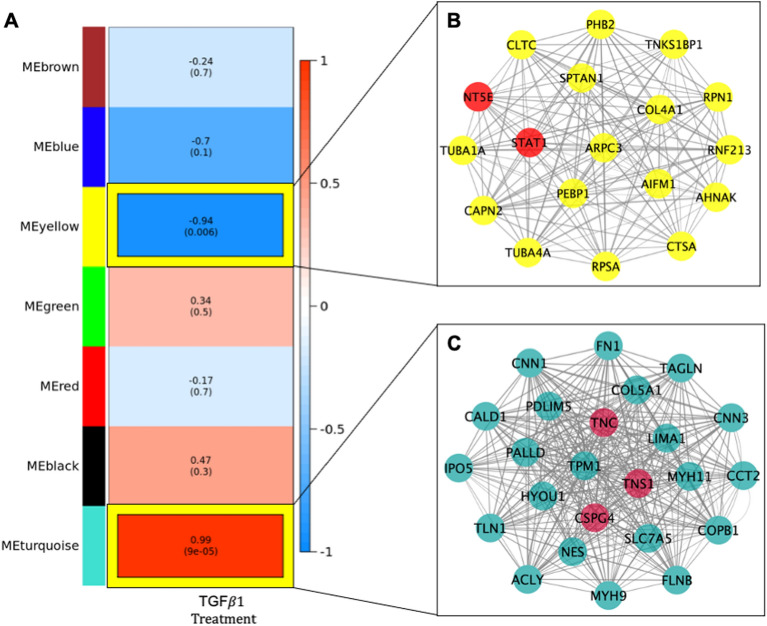
Figure 2.
Weighted gene co-expression network analysis of proteomic data generated from IMR-90 cells with and without TGFβ treatment. (A) Proteomic Modules Associated with TGFB1 Treatment in IMR-90 cells. Values represent correlation with p-values in parentheses between each module and trait. Heatmap shading corresponds to strength of association where darker red cells have higher upregulation and darker blue cells have higher downregulation based on correlation. Text outlined in yellow denotes result withstands Bonferroni correction for multiple testing based on the number of modules generated. (B,C) Network of hub proteins in proteomic modules significantly associated with TGFβ Treatment. Proteins with a kME larger than 0.90 were selected for visualization in the turquoise (B) and yellow (C) modules. The size of the circle in each network corresponds to increasing module membership and the thickness of the edge corresponds to increasing topological overlap (TOM), a measure of the strength of correlation between protein levels, which is the Pearson’s correlation obtained from the adjacency matrix. Yellow nodes correspond to significant single proteins in the turquoise module associated with TGFβ1 treatment. Red nodes correspond to known targets of pirfenidone and/or nintedanib.

