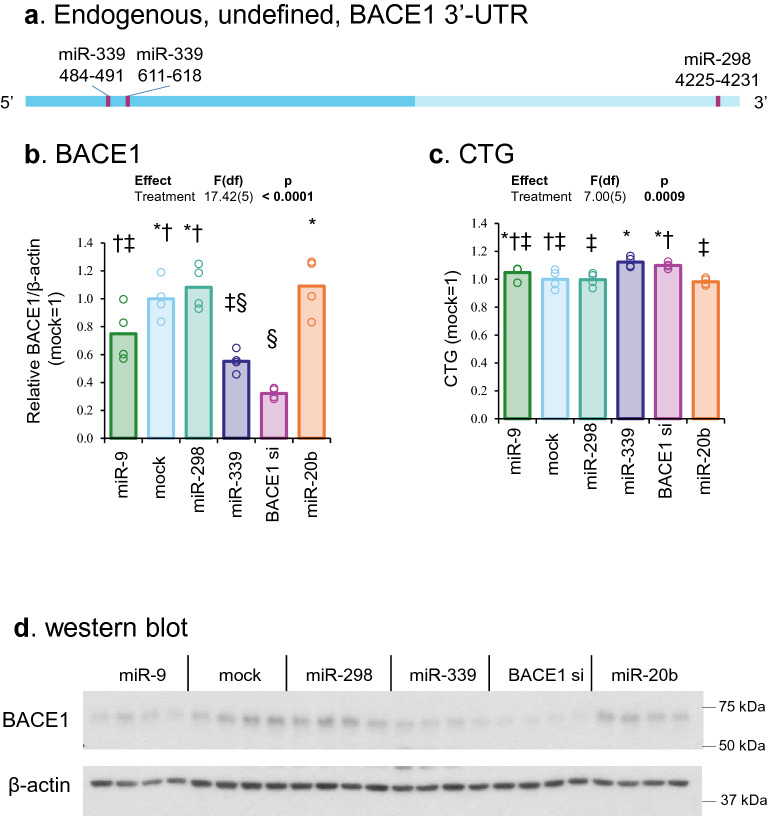
Figure 5.
Effects of miR-298 and miR-339 on endogenous BACE1 levels in differentiated neuroblastoma cells. (a) Scale drawing of endogenous BACE1 mRNA undefined 3′-UTR with miR-339 and miR-298 binding sites. Dash line represents potential truncation or alternation of BACE1 3′-UTR. (b) Densitometric analysis. (c) CTG assay. Each letter represents a different group. (d) Western blotting of BACE1 and β-actin. Results of pairwise comparison of all treatments is shown by symbols. Treatments sharing a symbol did not significantly differ (p < 0.05). "(ns)" indicates no significant pairwise differences.

