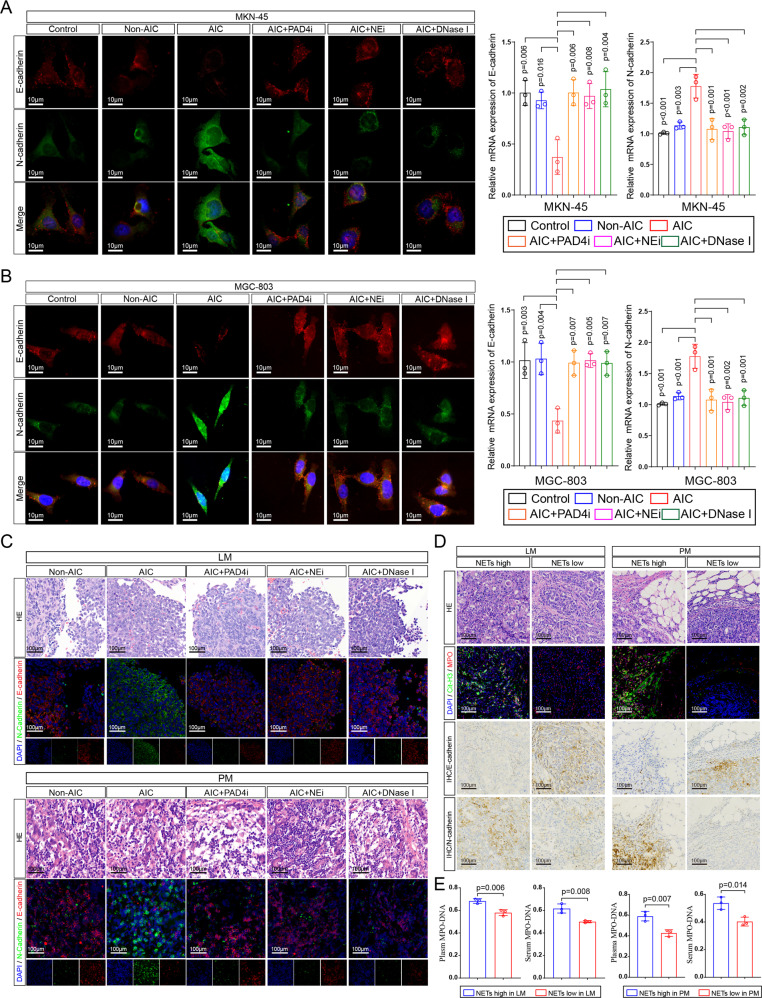
Fig. 3. NETs modulate EMT in GC cells.
A, B Left panel: representative immunofluorescence co-staining of DNA, E-cadherin and N-cadherin in MKN-45 (A) and MGC-803 (B) cells as indicated treatments (PADi, NEi, or DNase I were used to inhibit NETs specifically). Right panel: The mRNA levels of E-cadherin and N-cadherin in MKN-45 and MGC-803 cells as indicated treatments were assayed by quantitative reverse transcriptase (qRT)–PCR; C Representative HE (metastatic lesions) and immunofluorescence co-staining images of DNA, E-cadherin and N-cadherin in liver (upper panel), and peritoneum (down panel) collected from LM and PM nude mice (n = 5 per group) as indicated in Fig. 2C, D; D Representative HE, immunofluorescence co-staining images of DNA, Cit-H3, and MPO, immunohistochemical images for E-cadherin and N-cadherin in metastatic leasions from GC patients with LM (n = 3) or PM (n = 3); E Plasma and serum levels of MPO–DNA in GC patients as indicated in Fig. 3D. Data represent the mean ± S.D. in A, B (n = 3 biologically independent experiments) and D, E (n = 3 per group); one-way ANOVA with Tukey test was used in A, B; Unpaired Student’s t-tests were used in E. Source data are provided as a Source Data file.

