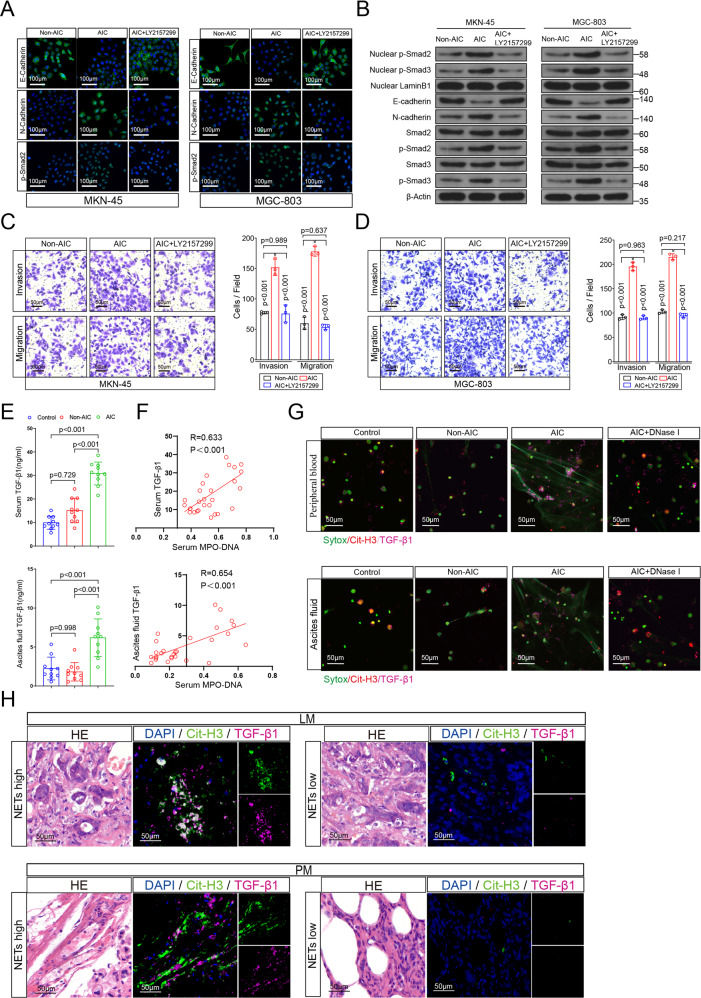
Fig. 4. NETs induced invasion, migration and EMT of GC cells dependent on TGF-β signaling pathway activation.
A, B Left panel: representative immunofluorescence staining was used to compare E-cadherin, N-cadherin and p-smad2 in MKN-45 (A) and MGC-803 (B) cells as indicated treatment (LY 2157299, a TGF-β inhibitor). Right panel: Western blotting was used to compare E-cadherin, N-cadherin, Smad3, p-Smad3, nuclear p-Smad3, Smad2, p-Smad2, and nuclear p-Smad2 in MKN-45 (A) and MGC-803 (B) cells as indicated treatment; C, D Transwell Matrigel invasion and migration assays for MKN-45 (C) and MGC-803 (D) cells as indicated treatment. E Serum and ascites fluid TGF-β1 levels in GC patients with control, Non-AIC and AIC groups; F Correlation between serum MPO–DNA and serum TGF-β1, ascites fluid MPO–DNA and ascites fluid TGF-β1 levels in GC patients with control (n = 10), Non-AIC (n = 10) and AIC (n = 10), the Pearson’s correlation coefficient R-value and the p-value are shown in the figures; G Representative immunofluorescence co-staining images of DNA, Cit-H3, and TGF-β1 to located NETs and TGF-β1 in the neutrophils isolated from peripheral blood (upper panel) and ascites fluid (down panel) of control, Non-AIC, AIC and AIC + DNase I groups; H Representative HE and immunofluorescence co-staining images of DNA, Cit-H3 and TGF-β1 in LM and PM from GC patients. Data represent the mean ± S.D. in C, D (n = 3 biologically independent experiments) and E (n = 10 per group); one-way ANOVA with Tukey test was used in C, D, E. A, B, C, D, G, H were representative of three biologically independent experiments. Pearson correlation coefficient analysis were used in F. Source data are provided as a Source Data file.

