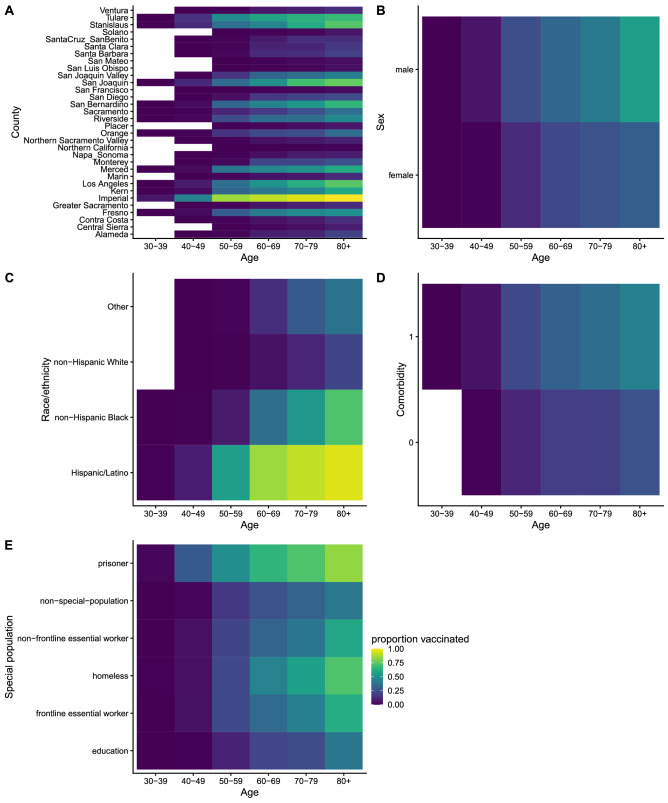
Figure 4.
Optimal vaccine allocation under simultaneous targeting by multiple risk factors. Plots show the proportion of individuals in each (A) age-and-county group, (B) age-and-sex group, (C) age-and-race/ethnicity group, (D) age-and-comorbidity-status group, and (E) age-and-special population group vaccinated under optimal distribution of the first 5 million vaccinations in California. Lighter yellow colors show where higher proportions of individuals are vaccinated, darker blue colors where lower proportions of individuals are vaccinated. We assume all healthcare workers, skilled nursing facility residents and assisted living facility residents are vaccinated first before essential workers and other groups as per the US CDC recommendation. Vaccinations are optimally allocated to avert DALYs across all risk factors (demographic, special population, and comorbidities). Comorbidity status is treated as binary (0 = no comorbidity, 1 = any comorbidity). The proportions of individuals vaccinated under optimal vaccine distribution for each of the individual risk factors are shown in Figure S5.

