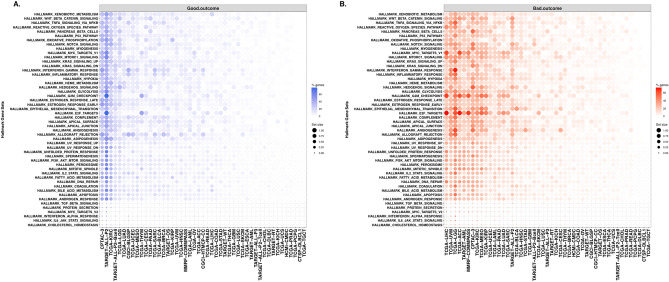
Figure 5.
Hallmark genesets with enrichment of survival-associated genes. Summary of significantly associated hallmark genes with good (A) and bad (B) overall survival for each hallmark gene set for each cancer type. The dot color gradient represents the percentage of genes per gene set (% genes) that are significantly associated (p-value < 0.05) with survival outcome, while the size of the dots represents the total number of genes within a gene set (set size). The blue and orange color gradients indicate the good (HR < 1) and bad (HR > 1) survival outcomes.

