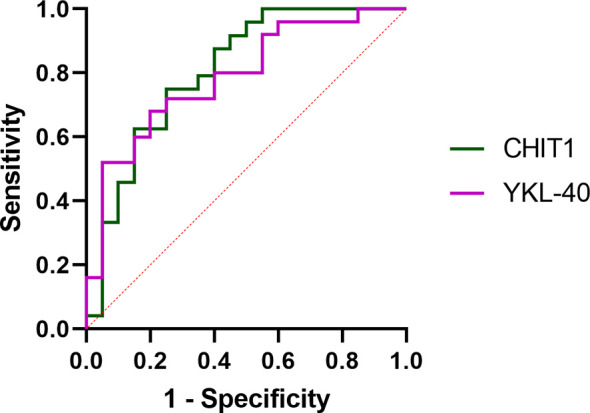
Figure 3.

ROC curve analysis of serum CHIT1 activity and YKL-40 concentration to distinguish IPF from control subjects. ROC, receiver operating characteristic; CHIT1, chitotriosidase; YKL-40, chitinase 3-like 1.

ROC curve analysis of serum CHIT1 activity and YKL-40 concentration to distinguish IPF from control subjects. ROC, receiver operating characteristic; CHIT1, chitotriosidase; YKL-40, chitinase 3-like 1.