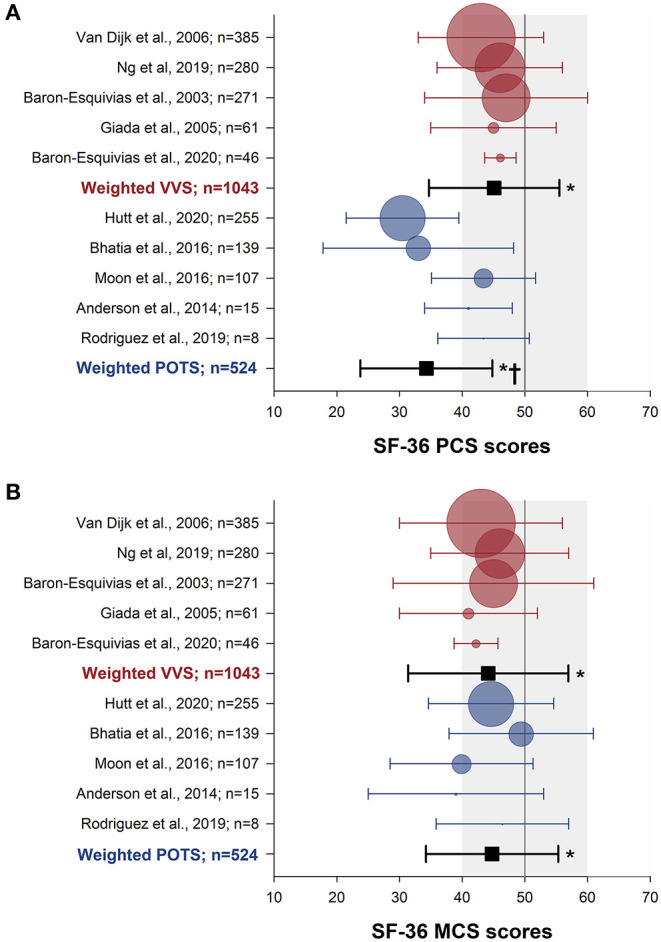
Figure 2.

Meta-analysis of SF-36 summary scores in patients with VVS and POTS compared to normative data. Physical (A) and mental (B) component summary scores are shown for patients with VVS (27–30, 56) (red) and POTS (41, 43–46) (blue). Data for each study are presented as the mean (circle) and standard deviation (whiskers) with the size of the circle proportional to the study sample size. Weighted means and standard deviations for combined data for patients with VVS and POTS are indicated with black squares. Vertical lines and gray shading denote the mean and standard deviation based on US normative data (n = 2,474) (58). *Significantly different to US normative data at the 0.001 level of significance.†Significantly different to the VVS group, at the 0.001 level of significance.
