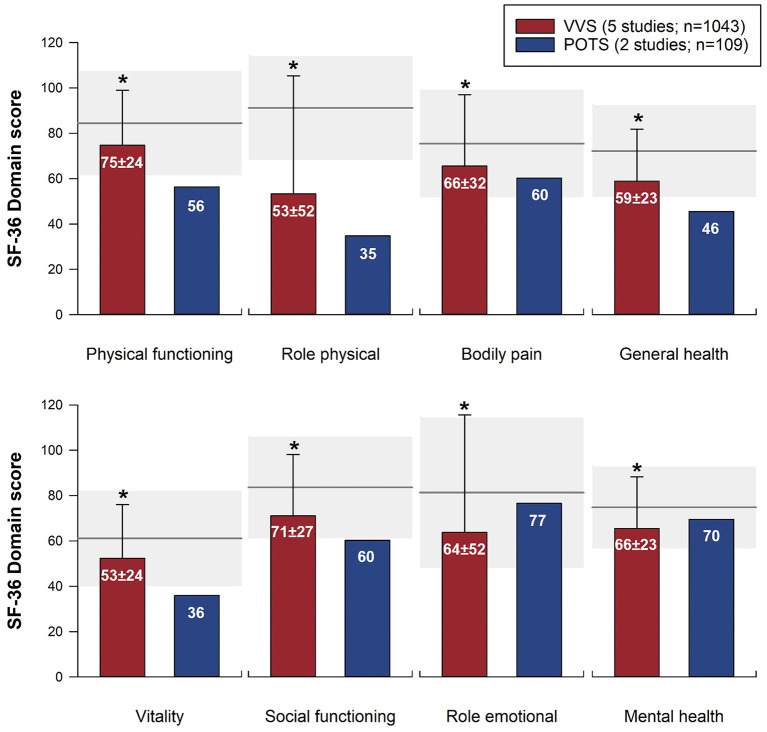
Figure 3.
Meta-analysis of SF-36 domain scores in patients with VVS and POTS compared to normative data. SF-36 domain scores are shown for patients with VVS (26–30) and POTS (9, 46). Bars represent weighted means and standard deviations for patients with VVS and POTS. Note that the two POTS studies did not report a measure of error; the mean scores from these studies are presented for reference, but have not been included in the statistical analysis. Horizontal line and gray shading denote the mean and standard deviation based on US normative data (n = 2,474) (58). *Significantly different to US normative data at the 0.001 level of significance.

