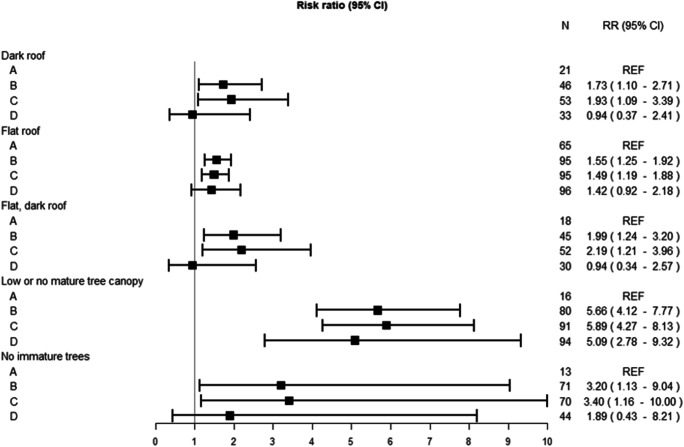
Fig. 2.
Risk ratio estimates of asssociation comparing proportion of 100 residential properties in grade B, C, and D vs. grade A areas of Philadelphia, PA, respectively, with present-day heat vulnerability enhancing housing or land cover characteristics, adjusted for neighborhood socioeconomic environment (measured using an index measure combining dimensions of housing environment, educational attainment, and unemployment), and for racialized segregation (measured using the Index of Concentration at the Extremes comparing proportion Black vs. proportion white) in the 1940s

