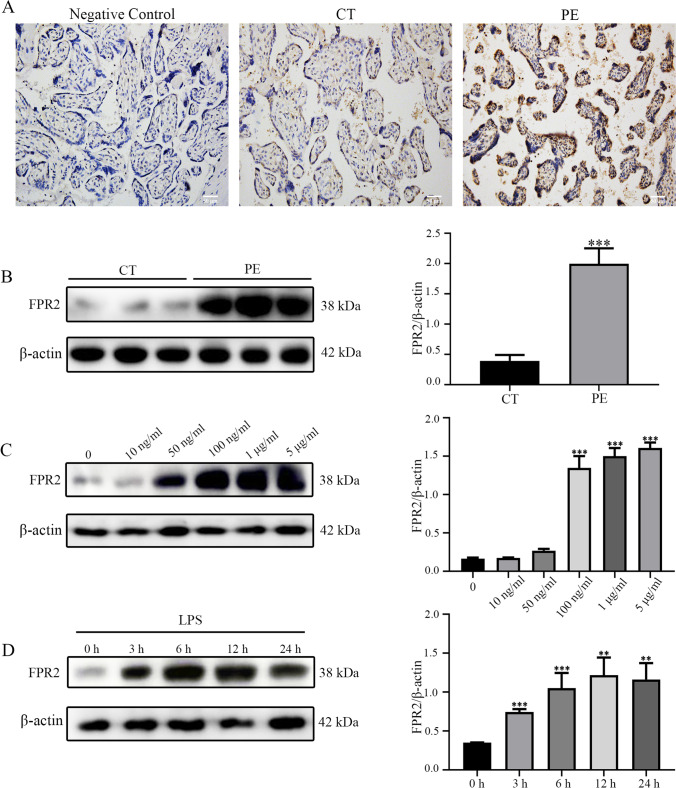
Fig. 1.
The expression levels of FPR2 were significantly increased in the placenta tissues of patients with PE. (A) The expression levels of FPR2 in placenta tissues from CT (n = 10) and patients with PE (n = 10) were detected using immunohistochemistry analysis. Scale bar, 50 μm. (B) The expression levels of FPR2 were determined using western blotting analysis (***P < 0.001: PE vs CON group). (C) The expression levels of FPR2 in response to treatment of HTR8/SVneo cells with different concentrations of LPS (0, 10, 50 and 100 ng/mL, 1 and 5 μg/mL) (***P < 0.001: LPS vs CON group). (D) The expression levels of FPR2 following different durations of treatment (0, 3, 6, 12 and 24 h) in the presence of 100 ng/ml LPS (**P < 0.01, ***P < 0.001: LPS vs CON group)

