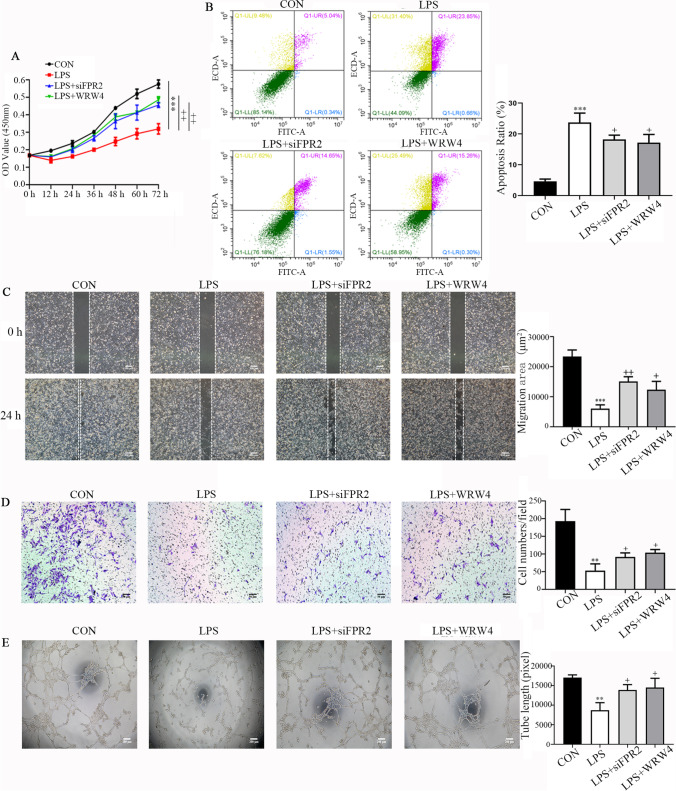
Fig. 3.
Knockdown of FPR2 expression or inhibition of its activity rescues the proliferation, apoptosis, migration, invasion and tube formation abilities of HTR8/SVneo cells pretreated with LPS. (A) The proliferation curves were determined using the CCK8 assay. The plots represent the proliferative ability of HTR8/SVneo cells (***P < 0.001: LPS vs CON group; + + P < 0.01: LPS + siFPR2 or LPS + WRW4 vs LPS group). (B) Annexin V-FITC/PI staining and flow cytometry assays were used to determine the percentage of apoptotic cells following their treatment with LPS, LPS + siFPR2 and LPS + WRW4. Histogram analysis indicates the apoptotic rate of the cells in each group (***P < 0.001: LPS vs CON group; + P < 0.05: LPS + siFPR2 or LPS + WRW4 vs LPS group). (C) Representative microphotographs of the wound healing assay of HTR8/SVneo cells under different conditions at the 0 and 24 h time points. The histogram indicates the migration area (μm2) in each group. Scale bar, 200 μm (***P < 0.001: LPS vs CON group; + + P < 0.01, + P < 0.05: LPS + siFPR2 or LPS + WRW4 vs LPS group). (D) The representative images of the Transwell invasion assay at 24 h in the different treatment groups. The histogram indicates the comparison of the cell counts in each group. Scale bar, 50 μm (**P < 0.01: LPS vs CON group; + P < 0.05: LPS + siFPR2 or LPS + WRW4 vs LPS group). (E) Representative images indicating the cell tube formation under different conditions at 4 h. Histogram indicating the quantification of the tube formation activity of HTR8/SVneo cells. Scale bar, 200 μm. (A-E) The LPS concentration used was 100 ng/ml. The siFPR2 and WRW4 concentrations used were 600 ng/ml and 10 μg/ml, respectively (**P < 0.01: LPS vs CON group; + P < 0.05: LPS + siFPR2 or LPS + WRW4 vs LPS group)

