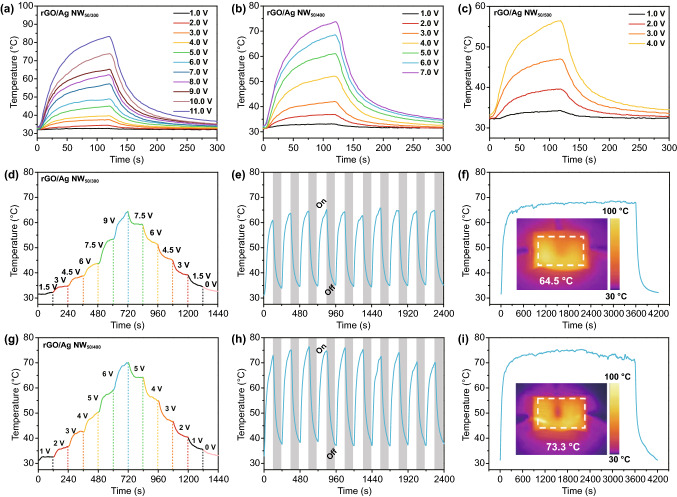
Fig. 6.
a–c Temperature–time profiles of the rGO/Ag NW50/300, rGO/Ag NW50/400, and rGO/Ag NW50/500 at different applied voltages. d Tailored surface temperature of the rGO/Ag NW50/300 upon stepwise voltages. e Heating cycles of the rGO/Ag NW50/300 upon repeated applied voltage of 9.0 V. f Electrical heating time–temperature curve at a constant voltage of 9.0 V for 1 h. The inset is IR image of rGO/Ag NW50/300 at 9.0 V. g Tailored surface temperature of the rGO/Ag NW50/400 upon stepwise voltages. h Heating cycles of the rGO/Ag NW50/400 upon repeated applied voltage of 6.0 V. i Electrical heating time-temperature curve at a constant voltage of 6.0 V for 1 h. The inset is IR image of rGO/Ag NW50/400 at 6.0 V

