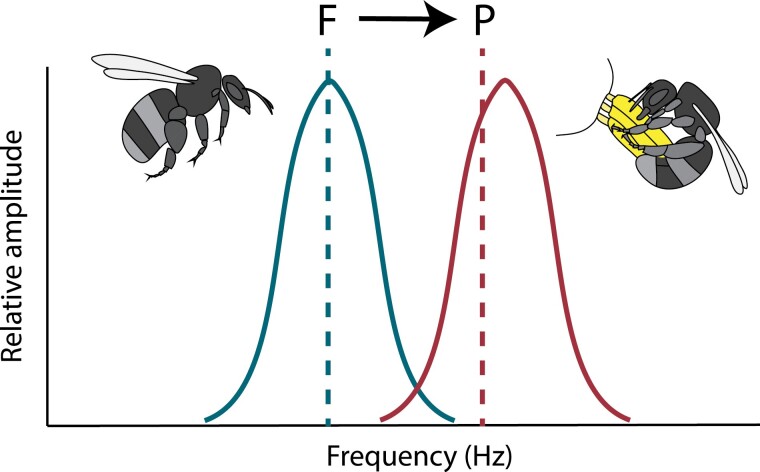
Fig. 3.
Hypothesized change in the relationship between natural frequency and thorax oscillation frequency between flight (blue; F) and floral (red; P) vibrations. The dashed line represents the natural frequency of the system at which resonance is expected to occur. The natural frequency of the system is influenced by the mass and inertial loading of the bee or coupled bee–flower system. Changes in wing deployment and stiffness of accessory muscles in the thorax cause a shift in natural frequency during flight (F; blue dashed line) and floral (P; red dashed line) vibrations. The solid lines represent the distribution of frequencies generated by individual bees through the contraction of the indirect flight muscles under the two different behaviours. Notice that while flight vibrations closely match the natural frequency, floral vibrations could be driven at a higher frequency than the corresponding natural frequency of the thorax.

