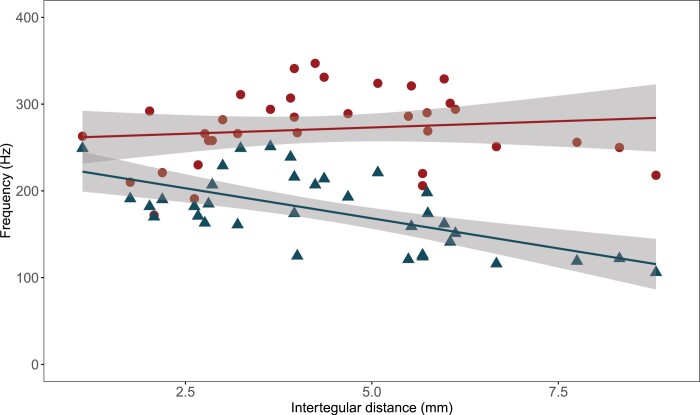
Fig. 4.
Relationship between frequency (Hz) and bee size (intertegular distance, mm) for both floral vibrations (red circles) and wingbeat (blue triangles) for 35 species of bees sampled in tropical and temperate communities in the Americas. Each bee species is represented by a pair of symbols (one circle and one triangle). The lines and grey regions represent a linear model and its associated 95% confidence interval calculated with the function geom_smooth in R (R Development Core Team, 2021), fitted separately for flight and floral buzzes. The Pearson’s correlation coefficient (95% confidence interval) for flower buzzes is ρ=0.126 (–0.216, 0.441) and for wingbeat is ρ= –0.628 (–0.795, –0.374). Data from Burkart et al. (2011) and De Luca et al. (2019).

