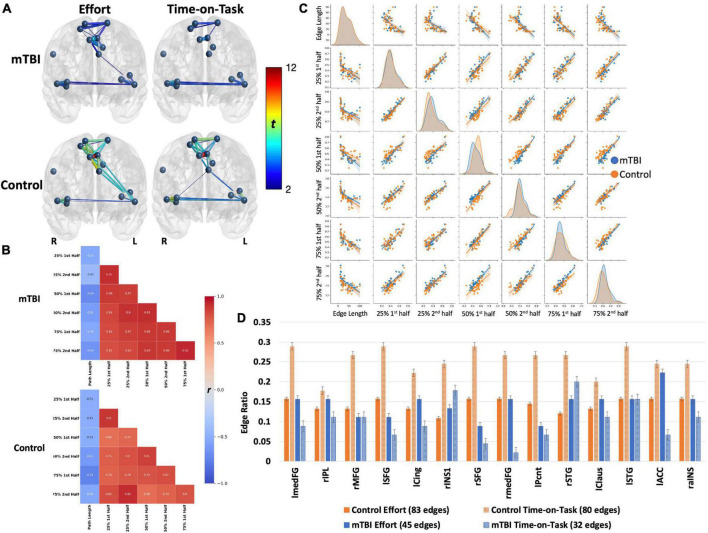
FIGURE 4.
Both groups demonstrated robust main effects for effort level and TOT with similar spatial distributions across effects (effort or TOT) and across groups (A). However, the effects were stronger in the control group (t-values presented by the color spectrum and edge thickness). For both groups, the edge with strongest effects (for effort and TOT) was the left medial frontal gyrus–right medial frontal gyrus [mTBI effort effect: t(63) = 5.24, control effort effect: t(40) = 11.81; mTBI TOT effect: t(63) = 4.61, control TOT effect: t(40) = 11.4, all ps < 0.001]. Connectivity between the left insular and medial frontal nodes was stronger for the effort effect in both groups, but only one edge connecting these brain regions was significant in the mTBI group (left precentral gyrus-left claustrum). Connections between medial frontal and insular or temporal nodes were absent in TOT for the mTBI group. The (B) heatmaps and (C) pairplots present correlation strengths and distributions (C, center diagonal) for the edges that were significant for effort level and TOT effects by group. The heatmaps show that for the controls (B, bottom), connectivity was strongest at the beginning of the task (25% effort level), indicated by darker red only in the top left corner, while connectivity was strong throughout the task in the mTBI group (B, top). The pairplots demonstrate that the FC over the course of the task was similar by group but more kurtotic in the OC group early in the task (at 25% second and 50% first). FC was more kurtotic at the end of the task for the mTBI group. The heatmaps and pairplots also present the negative relationship between edge length and FC in both groups, which was strongest at the 50 and 75% effort levels in the mTBI group, but more so for the 75% effort level in the OC group. The latter may indicate a “preference” for shorter Euclidean distances when a task becomes more effortful. (D) Node degree was presented as the number of connections each node was engaged in, standardized for the total number of significant edges in each effect (edge ratio), with more nodes engaged for the effect of effort level in the controls, but more nodes engaged in the TOT effect for the mTBI group. Error bars, standard error. lmedFG, left medial frontal gyrus; rIPL, right inferior parietal lobule; rMFG, right middle frontal gyrus; lSFG, left superior frontal gyrus; lCing, left mid cingulate cortex; rINS1, right insula 1; rSFG, right superior frontal gyrus; rmedFG, right medial frontal gyrus; lPcnt, left precentral gyrus; rSTG, right superior temporal gyrus; lClaus, left claustrum; lSTG, left superior temporal gyrus; lACC, left anterior cingulate cortex; and raINS, right anterior insula.

