FIGURE 5.
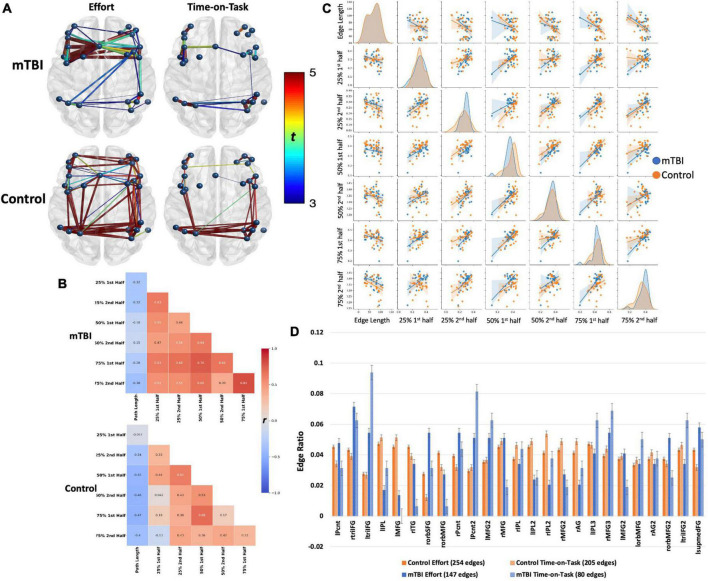
Frontoparietal network connectivity by group. Both groups demonstrated robust main effects for effort level and TOT with similar spatial distributions across effects (effort or TOT) and across groups. The effects were stronger in the control group (t-values presented by the color spectrum) than in the mTBI group but with small effect size (d = 0.25). Spatial distribution was larger for the effort level than for TOT in both groups, but effect sizes did not differ (mTBI d = 0.31 for both, control d = 0.41 for effort, d = 0.4 for TOT). However, on visual inspection of the network, the distribution of significant edges and stronger edges (t-values presented by color spectrum and edge thickness), was greater among the frontal nodes than the parietal nodes in the mTBI group. In contrast, connectivity was well distributed across nodes in the control group. This pattern, i.e., more and stronger connections in frontal than parietal nodes, is also evident in the TOT effect. The (B) heatmaps and (C) pairplot present the correlation strengths and distributions (C, center diagonal) for edges that were significant at the effort level and TOT effects by group, and the scatter plots present the relationships between each of the effort levels by TOT. The heatmaps demonstrate that the mTBI group (B, top) had stronger FC throughout the task with only slight increases in FC for the first half of each trial. In contrast, the connectivity of the controls varied consistently for the first half of the 50 and 75% effort levels. The pairplot presents the distributions of FP connectivity strength for the significant edges by group, and while the NBS results did not indicate strong group differences in the FP (evident in A), these plots make evident the differing patterns of FC relationships by group. First, the distributions differ in the OC by TOT, with a more kurtotic peak for the first trial at 25% that flattens in the second half at 25%, and then remain near the same for the other effort levels with slight skew to the right (stronger connectivity). This was not the case in the mTBI group where the distribution was kurtotic for all effort levels. In both groups, there were bimodal distributions, with smaller numbers of participant data skewed to the left (weaker connectivity). Also evident in the (B) heatmaps is the negative correlation of edge length with FC. This negative correlation was slightly weaker in the mTBI group, and there was a trend toward more negative FC path length correlations with increasing effort level in the OC group. (D) Node degree, presented as the number of nodes by the total number of edges for each effect and group, demonstrated group differences in the numbers of connections each node was engaged in, with higher degree in frontal nodes for the mTBI group relative to the control group. The involvement of frontal nodes was particularly higher for the mTBI group in the TOT effect. lPcnt, left precentral gyrus; rtriIFG, right inferior frontal gyrus triangularis 1; ltriIFG, left inferior frontal gyrus triangularis 1; lIPL, left inferior parietal lobule 1; lMFG, left middle frontal gyrus 1; rITG, right inferior temporal gyrus 1; rorbSFG, right superior frontal gyrus orbitalis 1; rorbMFG, right middle frontal gyrus orbitalis 1; rPcnt, right precentral gyrus 1; lPcnt2, left precentral gyrus 2; lMFG2, left middle frontal gyrus 2; rMFG, right middle frontal gyrus 1; rIPL, right inferior parietal lobule 1; lIPL2, left inferior parietal lobule 2; rIPL2, right inferior parietal lobule 2; rMFG2, right middle frontal gyrus 2; rAG, right angular gyrus 1; lIPL3, left inferior parietal lobule 3; rMFG3, right middle frontal gyrus 3; lMFG2, left middle frontal gyrus 2; lorbMFG, left middle frontal gyrus orbitalis 1; rAG2, right angular gyrus 2; rorbMFG2, right middle frontal gyrus orbitalis 2; ltriIFG2, left inferior frontal gyrus triangularis 2; lsupmedFG, left superior medial frontal gyrus.

