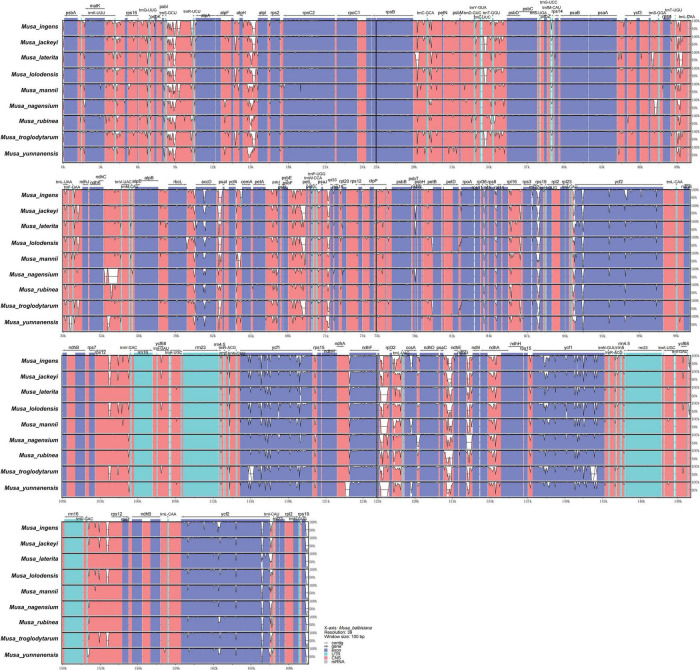
FIGURE 4.
mVISTA map of chloroplast genome of nine species of Musa. Sequence identity plot comparing the chloroplast genome of nine Musa species. The vertical scale indicates the percentage of identity, ranging from 50 to 100%. The horizontal axis indicates the coordinates within the chloroplast genome. Genome regions are color-coded as protein-coding, rRNA, tRNA, intron, and conserved non-coding sequences (CNS).

