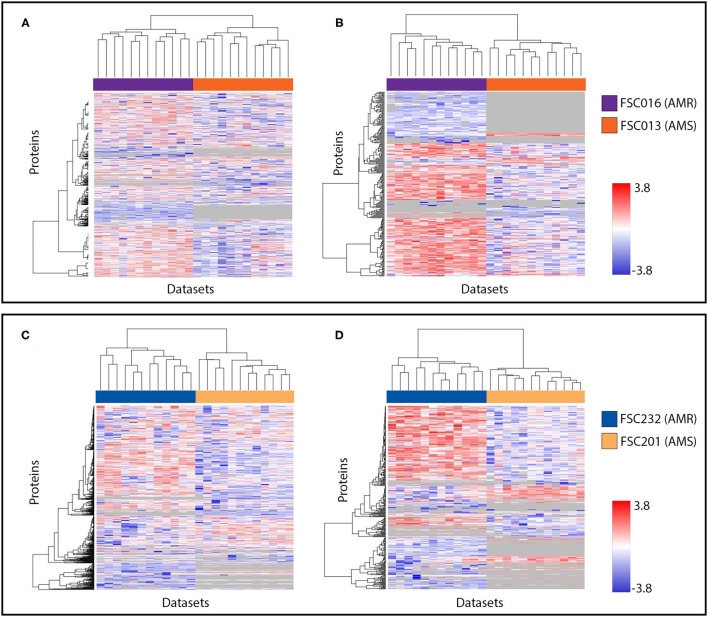
Figure 2.
Visualization of protein expression patterns reveals bidirectional protein expression changes in both F. tularensis strain pairs. (A,B) are data from FSC016/FSC013; (C,D) are data from FSC232/FSC201. (A,C) include all proteins observed in our analyses of both strain pairs at the early time point. (B,D) include the subset of proteins found to be significantly differentially expressed between AMR and AMS strains, as well as those found to be present/absent in this comparison. Proteins are represented in individual rows along the y-axis, and datasets are represented as individual columns along the x-axis. In all heat maps, hierarchical clustering was used to group proteins with similar expression trends. Expression levels are shown on a scale from blue (low) to red (high). Gray indicates the protein was not observed in a dataset.

