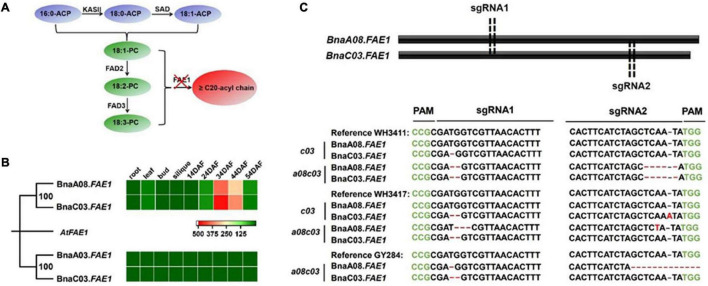
FIGURE 2.
BnaFAE1 gene analysis and mutant generation. (A) Illustration of desaturation and elongation of fatty acids. Red cross indicates mutation of FAE1 genes to block the synthesis of EA. (B) Expression pattern of BnaFAE1s in different tissues. (C) Location of CRISPR/Cas9 sgRNA-1 and sgRNA-2 targeting BnaFAE1 genes and sequencing identification of T2 homozygous mutants. PAM is indicated in green. Red “-” means deletions. Red font indicates nucleotide insertions and substitutions.

