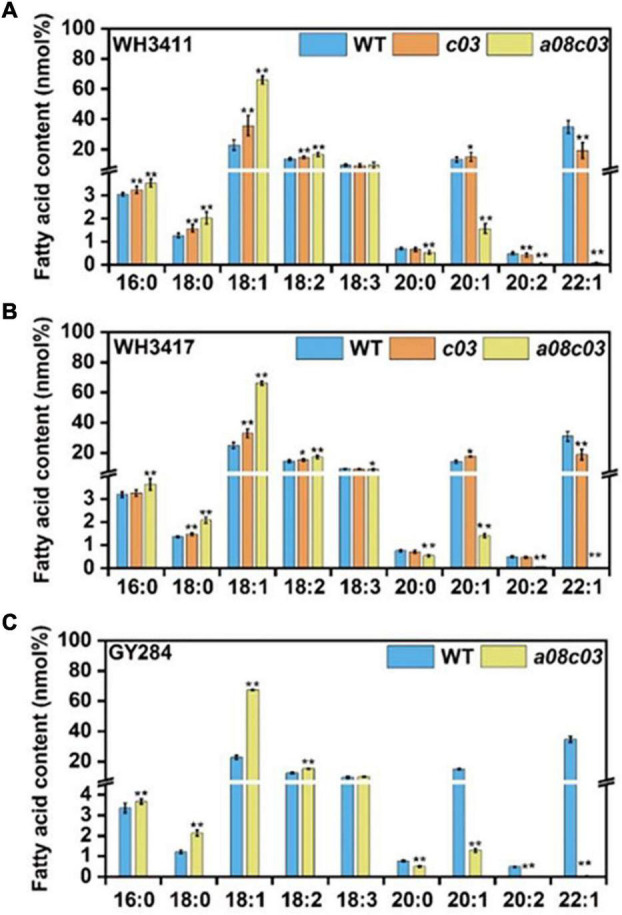
FIGURE 3.

The fatty acid composition phenotype of T2 mutants. Phenotype of fatty acid composition in WH3411 (A), WH3417 (B), and GY284 (C) backgrounds. c03 represents BnaC03.FAE1 homozygous mutant. a08c03 represents BnaC03.FAE1 and BnaA08.FAE1 homozygous double mutant. Values are means ± SD (n = 3∼5). *P ≤ 0.05; **P ≤ 0.01.
