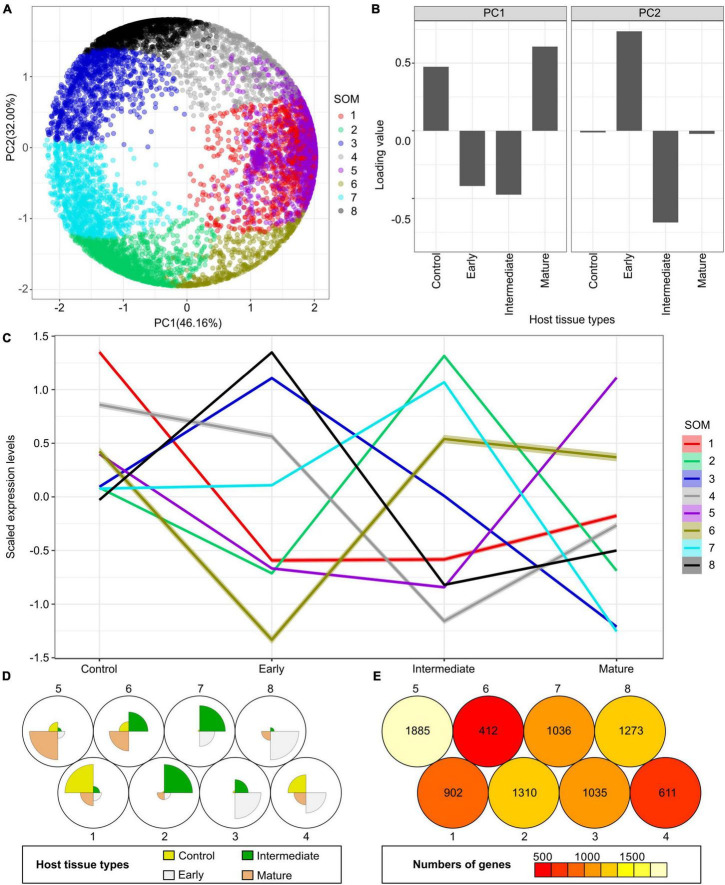
FIGURE 5.
Principal component analysis (PCA) and self-organizing maps (SOM) clustering of LCM RNA-Seq data from the host tomato tissues surrounding C. campestris haustoria. (A) PCA plot of the first and second principal components (PC1 and PC2) and colored indicate their corresponding SOM groups. Each dot represents a gene. (B) Loading values of PC1 and PC2. “Control” means the tomato stem cortex tissue samples that are not next to C. campestris haustoria, which serve as negative controls in this experiment. PC1 separates the genes specifically expressed in host tissues sounding the early and intermediate-stage haustoria from those specifically expressed in other stages. PC2 separates the genes specifically expressed in host tissues surrounding the intermediate-stage haustoria from those expressed explicitly at the mature stage. (C) A plot of each SOM group’s scaled expression levels at four types of host tomato tissue surrounding C. campestris haustoria at different developmental stages. The color of each line represents the SOM group it belongs to. The shaded area around the lines indicates the 95 percent confidence interval. (D) A code plot of SOM clustering showing which developmental stage predominantly expresses genes of each SOM group based on sector size. Each sector represents the host tissues surrounding C. campestris haustoria at a specific developmental stage and is colored according to the tissue types it represents in figure legends. The number 1-8 next to each circle represents the corresponding SOM group. (E) A count plot of SOM clustering represents how many genes showed differential expression in each SOM group. The numbers of genes are labeled inside each circle representing SOM. (D,E) The number 1–8 next to each circle represents the corresponding SOM group.

