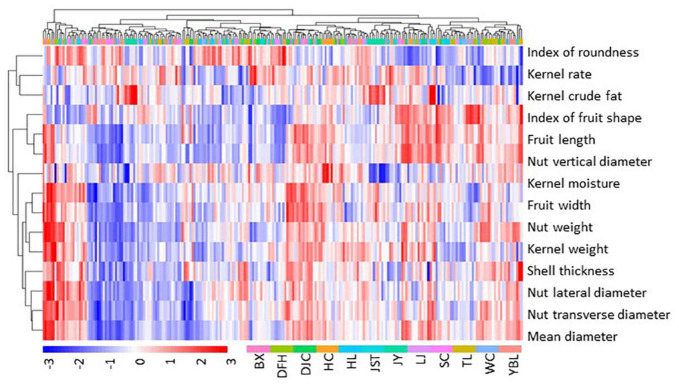
FIGURE 2.
Heatmap of fruit morphology. Fruit morphology data were scaled by subtracting the mean. Thus, positive values indicate above the mean (red), and negative values indicate below the mean (blue). Data of individual trees from each site, color coded as shown in the bottom of the figure, were used. BX, Binxian, HLJ; DFH, Raohe, HLJ; DJC, Ning’an, HLJ; HC, Hunchun, JL; HL, Hulin, HLJ; JST, Yichun, HLJ; JY, Jiayin, HLJ; LJ, Linjiang, JL; SC, Baishan, JL; TL, Tieli, HLJ; WC, Wuchang, HLJ; YBL, Yabuli, HLJ. HLJ, Heilongjiang province; JL, Jilin province.

