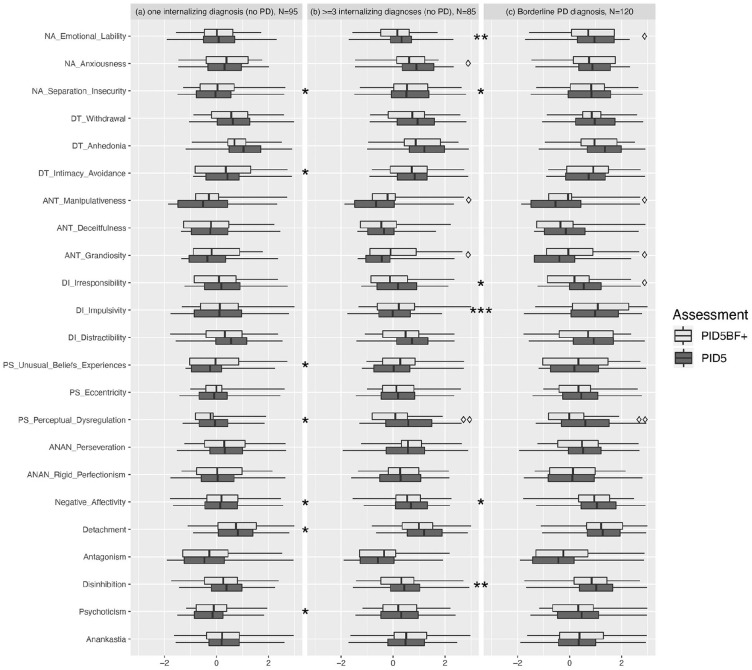
Figure 3.
Distribution (25% and 75% quartiles) and average scores of short and original versions of PID-5 scales in psychiatric inpatients with one (a) three or more (b) diagnoses from the internalizing spectrum (F32, F33, F34, F40, F41, F42, F43, F50, F51, F52, F53, ICD-10) or borderline PD diagnosis (c).
Note. All scores are z-standardized in relation to the German nonclinical sample. Asterisks denote significant (i.e., not containing zero within the confidence interval) between group difference effects (Cohens’ d) on PID5BF+ scales, deltoids denote significant difference effects between PID5BF+ and PID-5 scales, * or ◊ = 0.2 < d <.5, ** or ◊◊ = .5 < d < .8, *** or ◊◊◊ = d > .8. PID-5 = Personality Inventory for DSM-5.

